> ## Documentation Index
> Fetch the complete documentation index at: https://docs.superjoin.ai/llms.txt
> Use this file to discover all available pages before exploring further.
# Build a Dynamic Dashboard in Google Sheets with Superjoin
> Step-by-step guide to construct live, auto-updating dashboards in Google Sheets using Superjoin
### Demo video
Demo: Build a dynamic dashboard in Google Sheets with Superjoin
***
This guide walks you through constructing comprehensive live dashboards in Google Sheets using Superjoin to sync real-time data from tools like HubSpot. Whether you're analyzing your sales pipeline or tracking ongoing opportunities, you'll learn how to set up a powerful, dynamic report that stays up-to-date automatically.
## Introduction
With Superjoin, you can pull live sales pipeline data from [HubSpot](/integrations/hubspot/overview) directly into Google Sheets. This enables you to build dashboards that always reflect your latest business reality. Ideal for anyone responsible for pipeline analysis, these live dashboards remove manual updates and keep reports accurate.
### Prerequisites
* **Google Sheets access** with edit permissions on the target spreadsheet
* **Superjoin for Google Sheets** add-on installed (see [Quickstart](/quickstart))
* **Connected HubSpot account** with access to Deals and related objects
***
## Step 1: Import data with Superjoin
Superjoin connects Google Sheets to your business systems to keep data fresh without manual imports. Follow these steps to import live HubSpot pipeline data:
Install/add the Superjoin add-on if you haven't already
Click the **Superjoin** menu and select **Open Sidebar**
1. In the sidebar, click **Add Data Source**
2. Select **HubSpot** from the list of integrations
3. Authenticate your HubSpot account as prompted
1. Choose which HubSpot object to import (e.g., **Deals** for pipeline data)
2. Define the fields/columns you want (such as Deal Name, Amount, Stage, Owner, Close Date, etc.)
3. Set the import to **Auto-Sync** (recommended) for live updates (see [Formula Filldown](/features/formulae-filldown))
The Superjoin data will appear as a new sheet in your spreadsheet
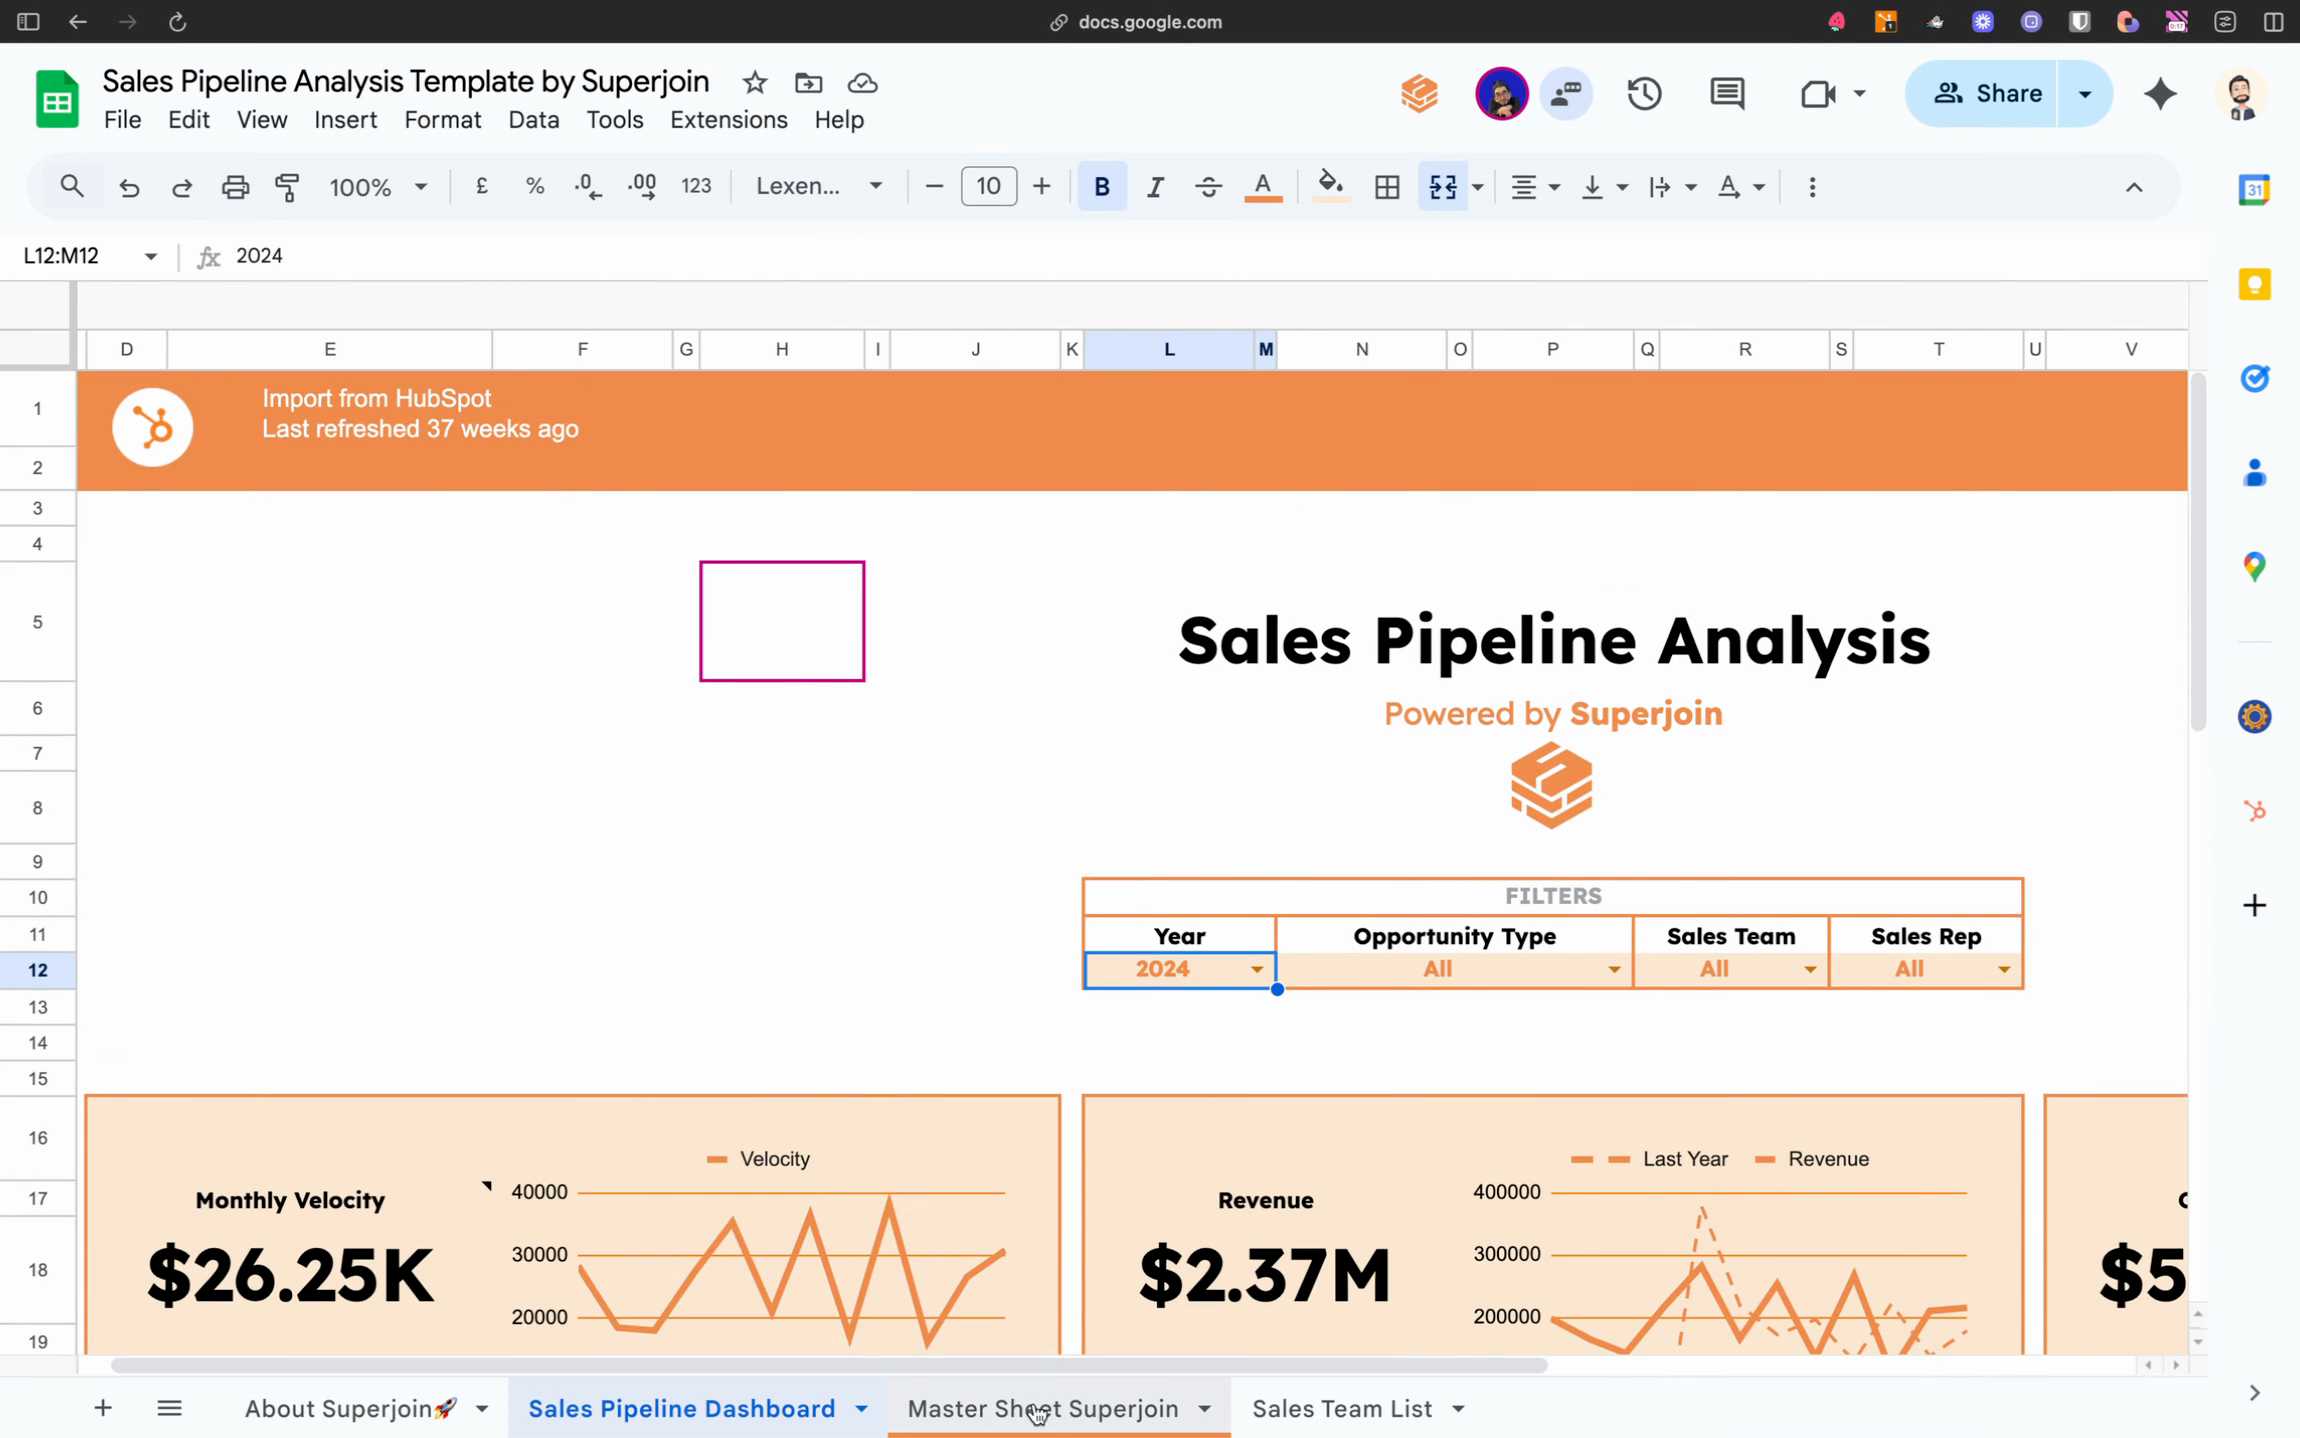
HubSpot pipeline data imported into Sheets via Superjoin. Monthly updates ensure your dashboard never goes stale.
With live pipeline data, your reports reflect the most up-to-date information for decision-making and forecasting.
***
## Step 2: Explore and build the dashboard
The dashboard you build on your Superjoin-connected sheet is fully dynamic. Here’s how to bring that to life:
Ensure all pipeline fields are present
Create a dashboard tab where you will build the report UI
1. Use formulas to pull numbers from your live data (explained in the next section)
2. If you change underlying data (like opportunity stages in CRM), your dashboard reflects those changes immediately
Filters drive everything. Changing the opportunity type updates metrics and visuals instantly.
***
## Step 3: Set up the live data sheet (best practices)
A key difference with Superjoin-powered dashboards: Your sheet is always syncing with the source, so:
1. **Do NOT directly edit the imported Superjoin sheet.** This ensures uninterrupted sync and future-proof updates.
2. **Leave all raw data columns untouched.**
3. **Add calculated/formula columns to the right:**
* Open a blank column adjacent to your imported data
* Use row-level formulas (e.g., `=IF([Status] = "Closed Won", 1, 0)`) to enrich your raw data
* Example calculations:
* Closed date conversions
* Stage buckets (Won/Open/Lost)
* Owner or team name extraction
4. **Superjoin auto-fills formulas for every new row** that syncs in future updates.
5. **Use the space beside the imported data** to transform and analyze without breaking the sync.
Do not overwrite or delete columns in the imported Superjoin sheet. Make your transformations in new columns to the right to preserve syncing.
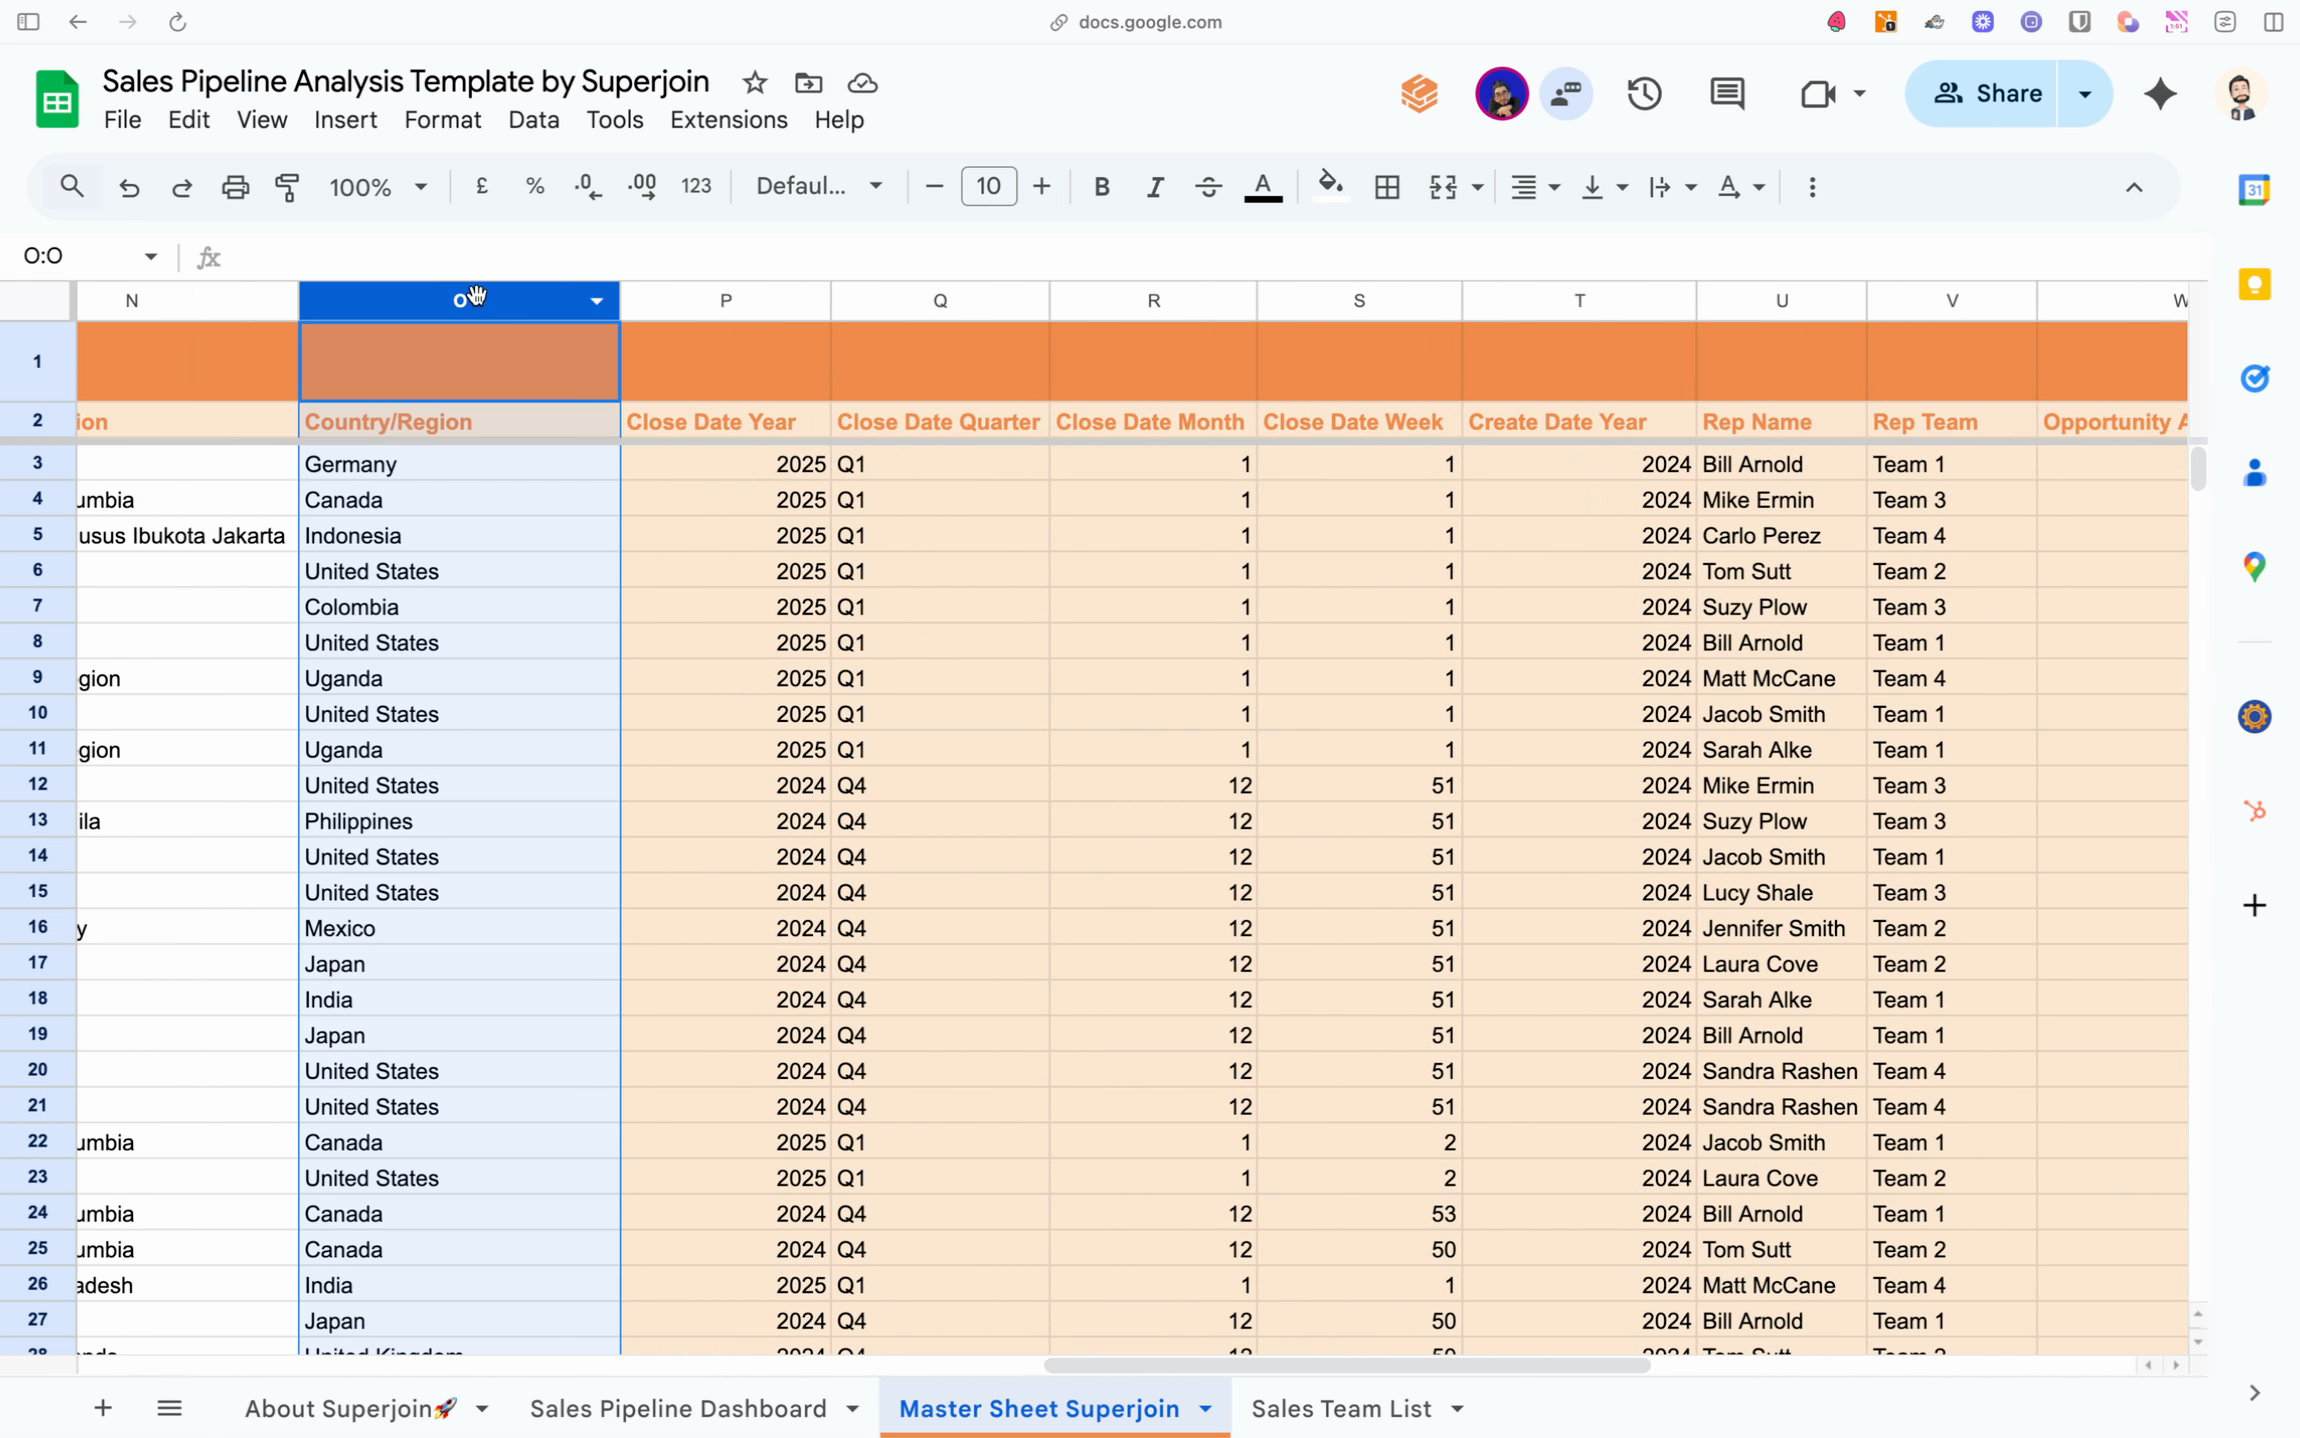
Adding formula columns to the right of imported Superjoin data for real-time calculations like extracting dates, amounts, and sales rep names. Superjoin auto-applies formulas to new rows as data is refreshed.
***
## Step 4: Build the metrics layer
This is the foundation of your dashboard – a "metrics block" where you summarize pipeline KPIs for display
Create a block (section) above/beside your imported/processed data
Use these example formulas:
```google-sheets theme={null}
# Total Pipeline Value
=SUMIF([Stage], "Open", [Amount])
# Won Revenue This Month
=SUMIFS([Amount], [Stage], "Closed Won", [Close Date], ">="&FirstOfMonth, [Close Date], "<="&Today)
# Deal Count
=COUNTIF([Stage], "Open")
```
Use structured references from your formula columns to simplify formulas
1. Use bold headers and light cell fills to clearly distinguish metrics from raw data
2. Display relevant KPIs important to your team (e.g., pipeline by segment, sales rep, deal type)
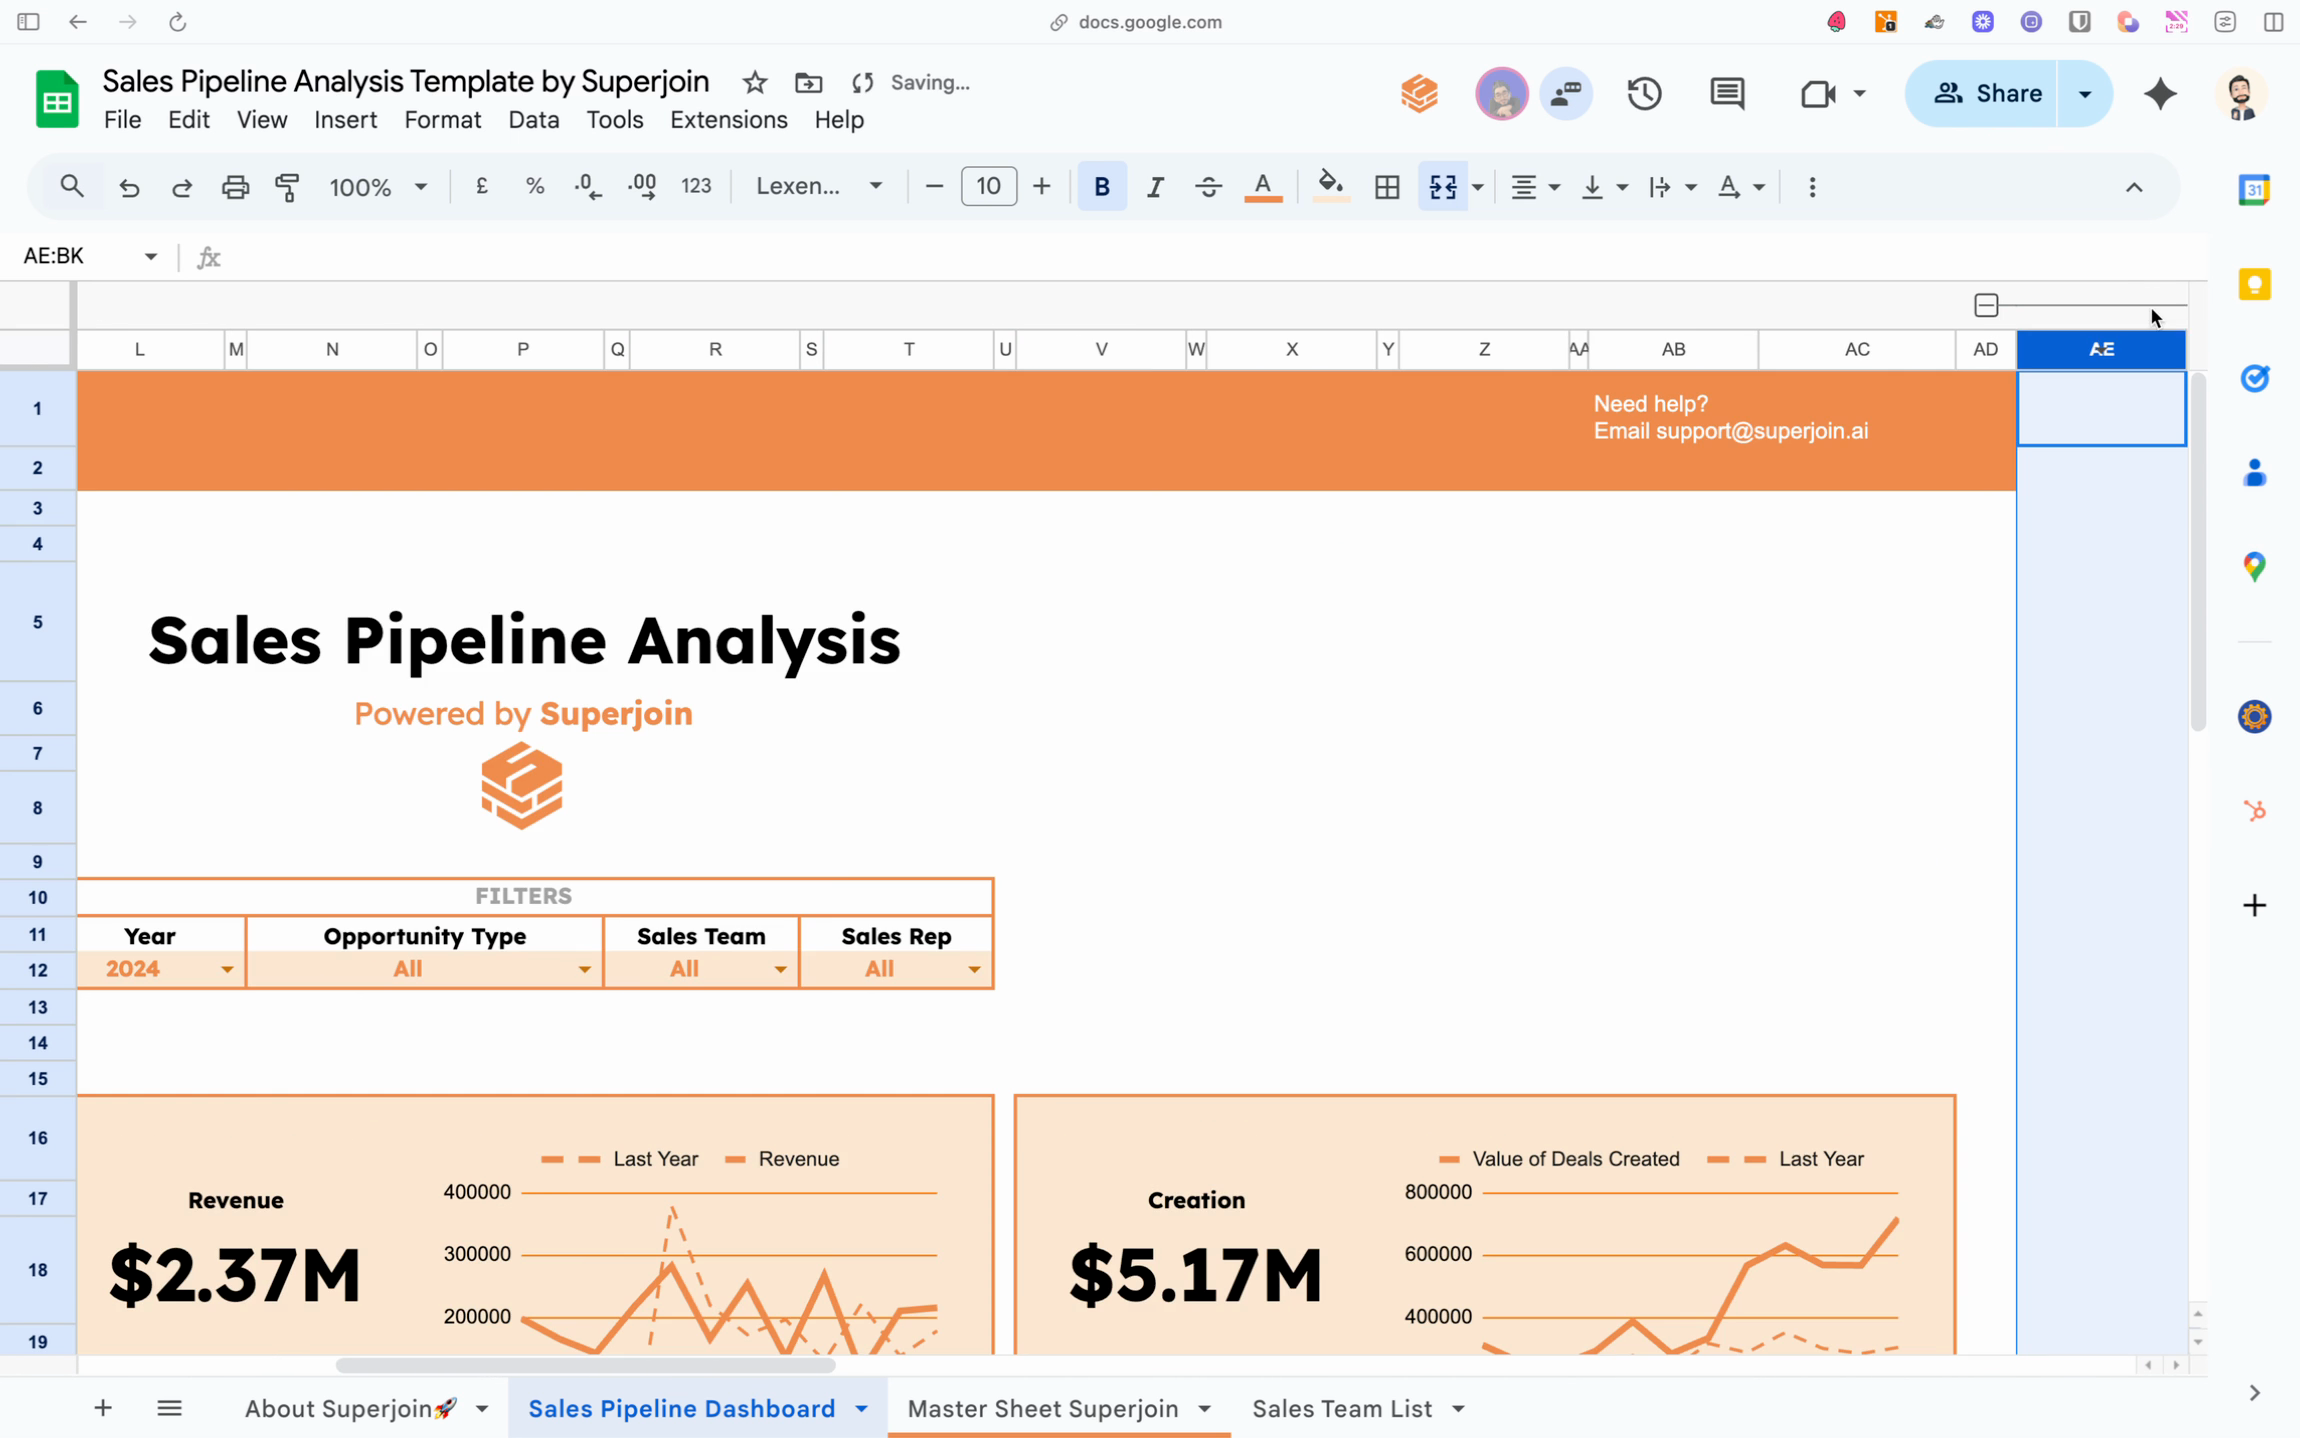
Metrics block with summary KPIs (deal count, pipeline value, closed revenue) dynamically calculated from imported Superjoin data.
***
## Step 5: Set up the drop-down filter
Dynamic filtering lets your dashboard viewers slice the data by attributes like opportunity type or business segment.
1. **Insert a drop-down cell** at the top of your dashboard area.
2. **Populate the drop-down with filter values:**
* Click the drop-down cell
* Go to **Insert > Drop-down** (Google Sheets) and select **Drop-down from a range**
* Choose a reference range — ideally, a list of unique values via `UNIQUE()` from your main data (e.g., all distinct Pipeline Types)
3. **Label the drop-down** (e.g., Select Opportunity Type).
4. **Point your summary and chart formulas to the drop-down selection:**
* Example: `=SUMIF([OpportunityType], $A$1, [Amount])` where `$A$1` is your drop-down cell
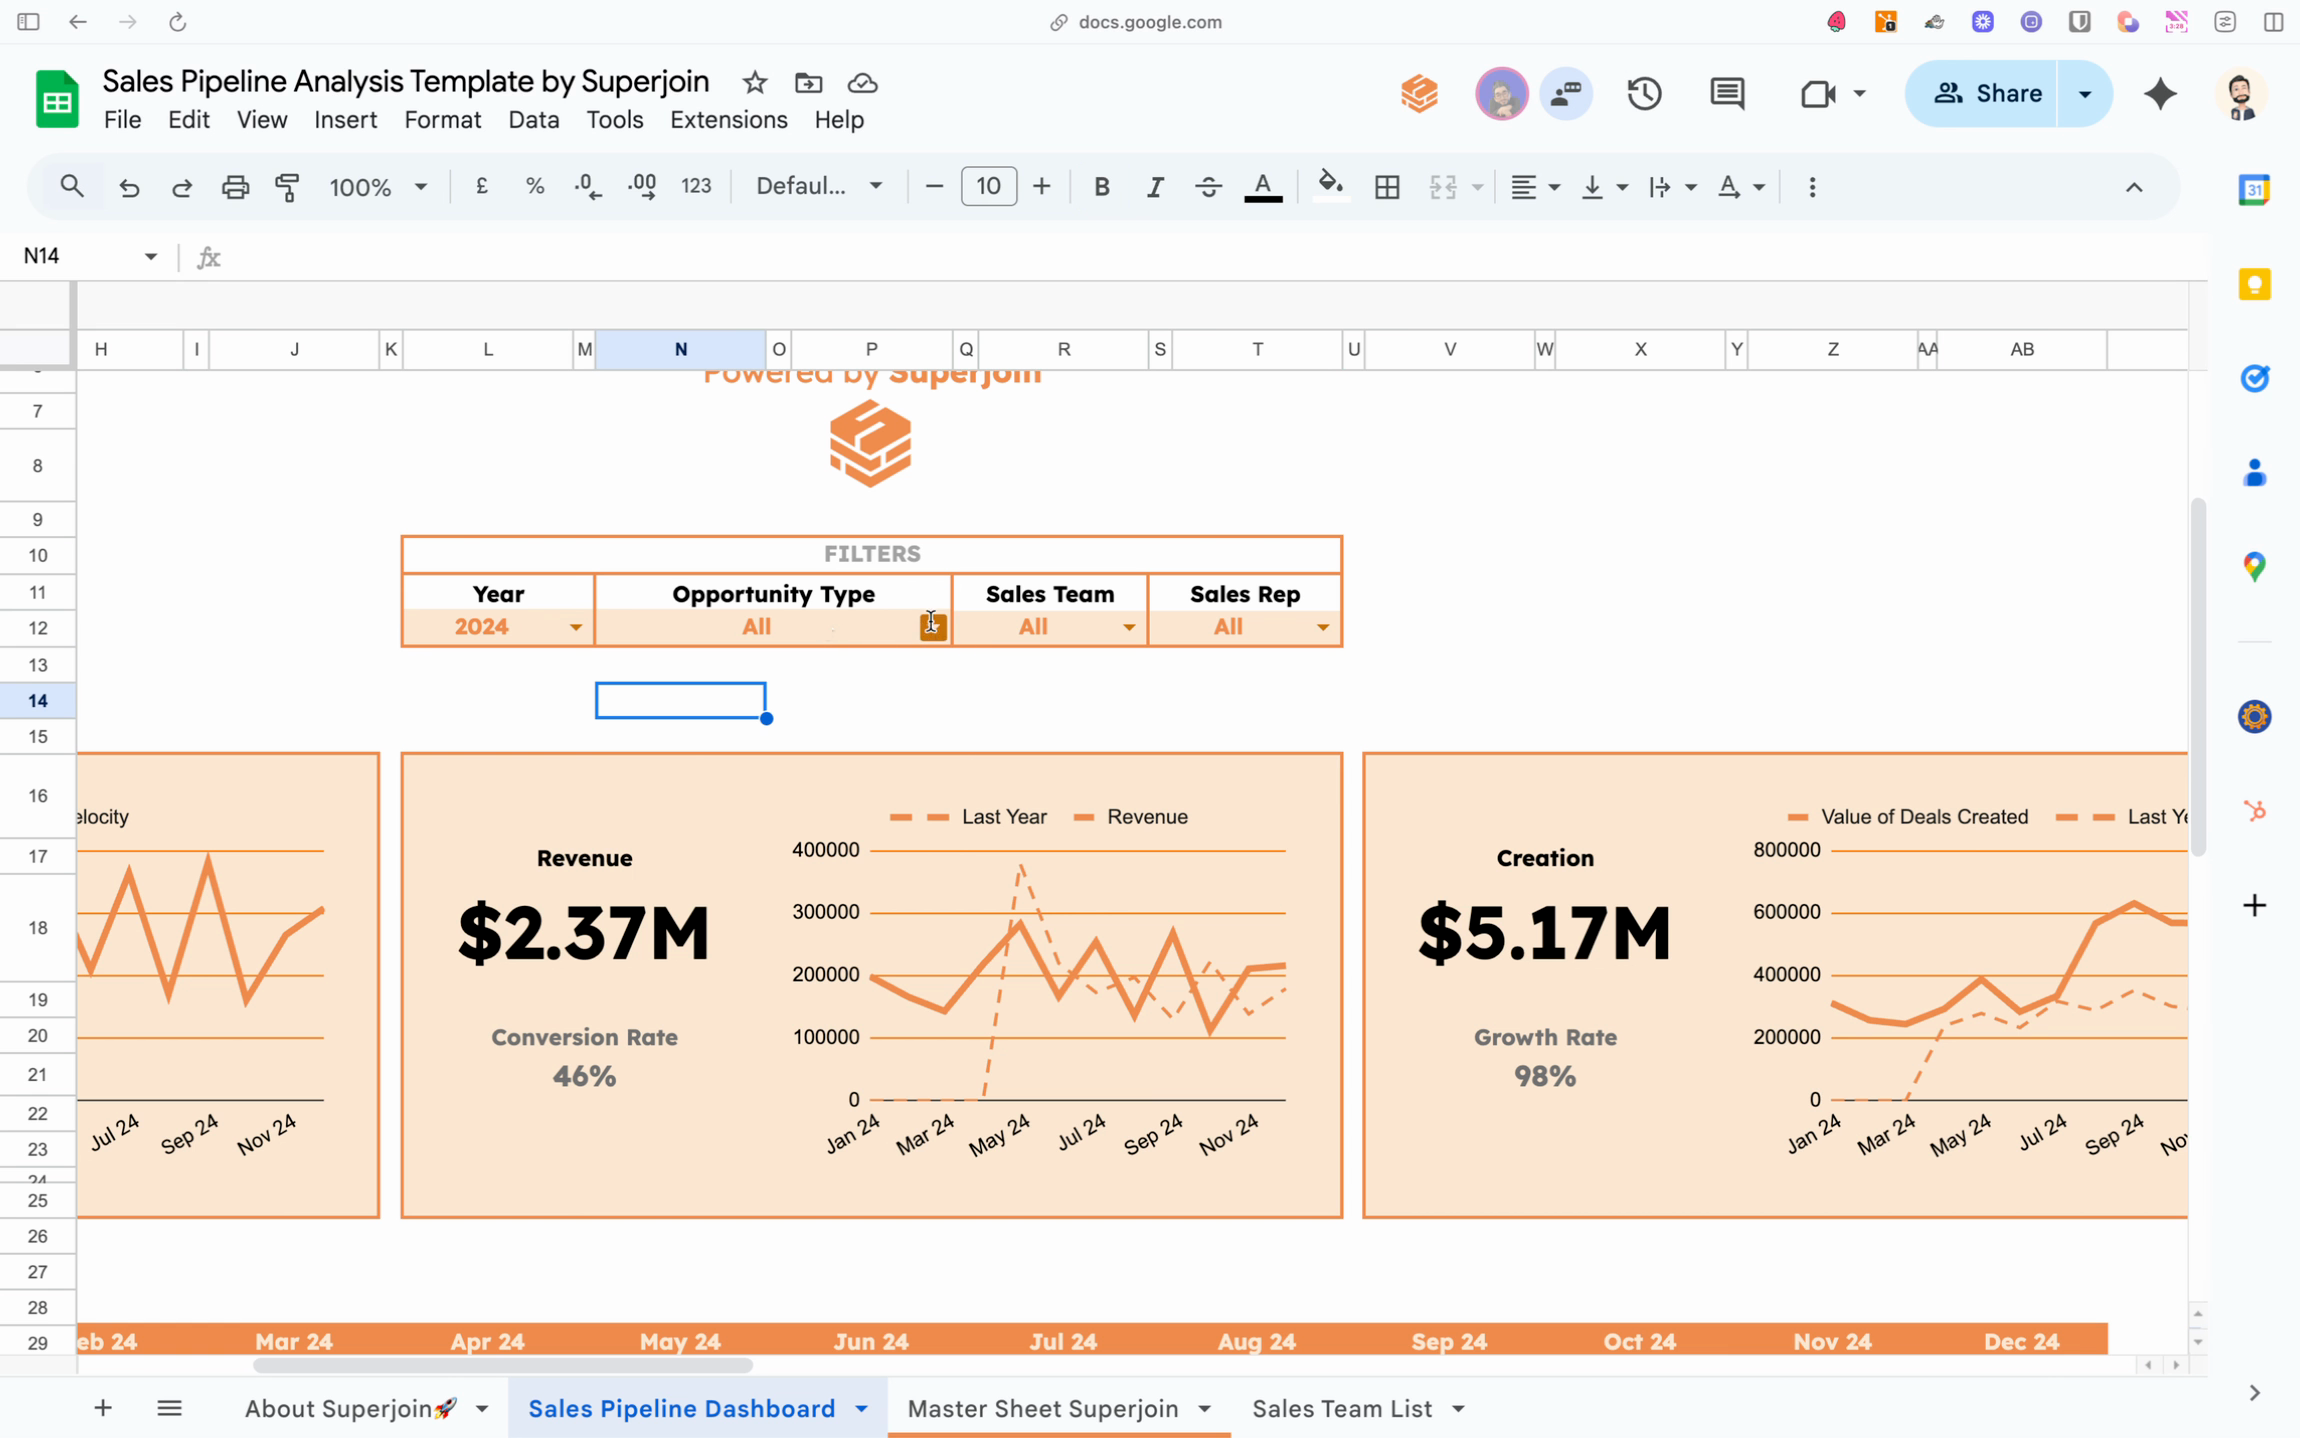
Dashboard with interactive drop-down filter for selecting opportunity type. Filtering options update dynamically as the dataset changes.
***
## Step 6: Use dynamic formulas
Tie your dashboard formulas to the filter selection so everything updates in real-time.
1. **Build formulas that reference the drop-down cell.** For example: `=SUMIFS([Amount], [OpportunityType], $A$1)`
2. **Apply similar formulas** to all relevant summary metrics and charts.
3. **Test by changing the drop-down** — all dashboard values should update instantly for the chosen filter.
4. **Handle edge cases:**
* Add formulas to show “All” or an empty state if nothing matches the selected filter
* Use `IFERROR` or `ISBLANK` to prevent errors when filter values are missing
***
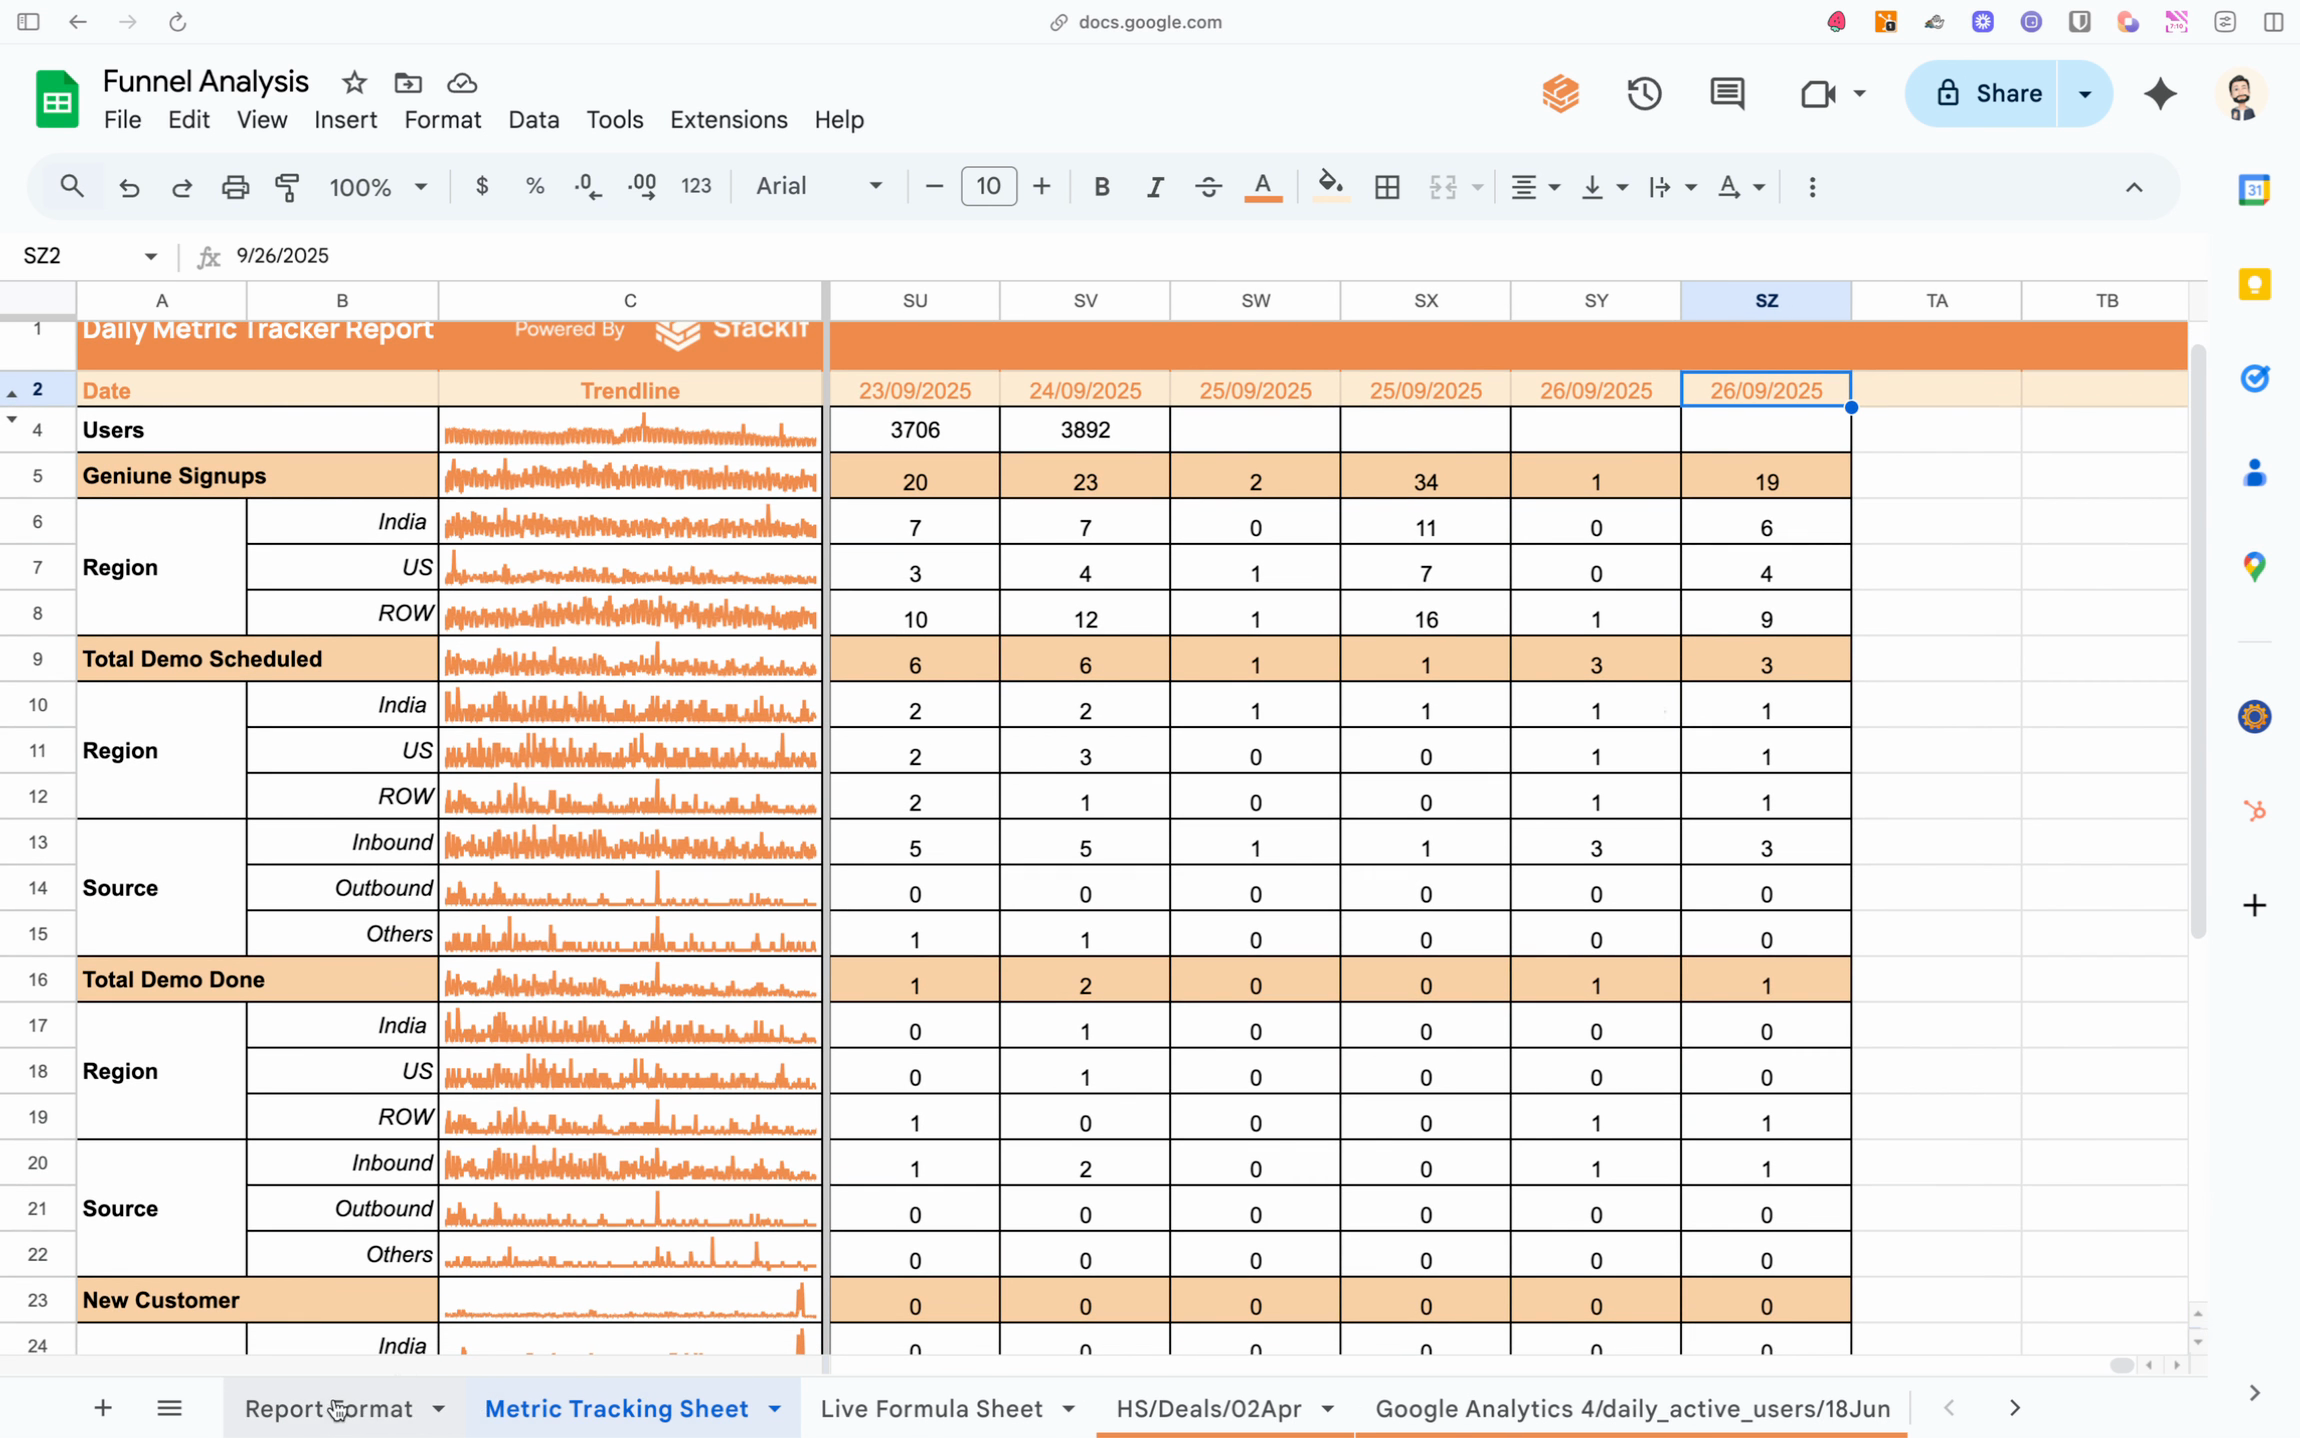
## Step 7: Automate historic data collection
Automating the collection of historical metrics is crucial for tracking trends and performance over time in your Superjoin-powered dashboards. Here's how to implement this process step-by-step:
1\. **Gather all summary metrics and KPIs from your metrics block.** These should be calculated on your middle layer using live, formula-based results connected to your Superjoin data. These metrics might include total pipeline value, closed revenue, deal count, or any custom KPIs you've built.
2\. **Prepare a separate tracking sheet dedicated to historic data storage.** Set up columns for the date (e.g., daily, weekly, or monthly), alongside each metric you intend to monitor over time.
3. **Automate snapshotting metrics at regular intervals:**
* Use Google Apps Script or manual methods to copy the latest values from your metrics block into the corresponding row of your tracking sheet
* Schedule this process to run daily, weekly, or on another cadence suited to your reporting needs
* Ensure that only values (not formulas) are pasted to preserve the historical record even as live data changes
4. **Track how your metrics change over time.** The tracking sheet gradually accumulates snapshots, allowing you to calculate trends, run comparisons, and visualize time series directly on your dashboard.
Historical data tracking and visualization in Superjoin dashboard
5. **Reference historic data in your dashboards:**
* Use dynamic charts and summary sections that read from your tracking sheet to showcase trends like pipeline growth, win rates, or period-over-period changes
* This historical context adds deeper analytical value than point-in-time numbers alone, enabling true analysis and forecasting
6. **Integrate your automated tracking into the overall dashboard flow:**
* Your live dashboard should pull both current and historic values, with the same filter logic from Step 5 applied as needed to surface targeted insights
* By layering real-time and historical data, your dashboard delivers ongoing visibility into both recent activity and long-term performance
7. **Summary and best practices:**
* Maintain a live Superjoin sheet for real-time sync
* Build a robust middle layer for calculated results
* Store regular metric snapshots in a tracking/history sheet
* Reference both live and trend data in your dashboard visualizations, with interactive filtering for drill-down analysis
***
## Conclusion: Dashboard structure overview
The full Superjoin dashboard workflow follows these layers:
* **Live data sheet** synced via Superjoin
* **Middle layer** of calculated formulas that reference the live data
* **Historical tracking sheet** for time-based analysis
* **Final dashboard** that combines metrics and trendlines for actionable reporting
This setup empowers you to create robust, interactive sales dashboards that require minimal maintenance and always stay current with your business data.
***
### Related resources
* [Quickstart](/quickstart) — Install the add-on and connect your first source in minutes.
* [Formula Filldown](/features/formulae-filldown) — Auto-apply formulas to new rows as data refreshes.
* [Scheduled refresh](/features/scheduled-refresh) — Keep dashboards current with automated refreshes.