This guide helps you automate daily snapshots of key metrics so you can analyze day-over-day, week-over-week, and month-over-month trends—without manual copying.
Demo
Why capture time trends?
When working with live dashboards in Superjoin, data reflects the current state—making it impossible to retrieve metrics from previous days. Capturing daily snapshots lets you:- Analyze day-over-day, week-over-week, and month-over-month changes
- Build historical trend lines
- Eliminate manual copy-pasting
Prerequisites
Superjoin is installed and your sheet is connected with at least one import set to refresh (manual, scheduled, or via workflow).
Overview of the approach
Live Data
Keep your Superjoin import(s) refreshing to power formulas.
Intermediate Formulas
Centralize key metrics in a middle-layer sheet with formulas.
Daily Snapshots
Use a workflow + script to paste values into a trends sheet.
Step-by-step
1
Review your live data setup
You should have a Superjoin sheet with live data being refreshed daily, weekly, or monthly. This data represents the state as of when it was last refreshed.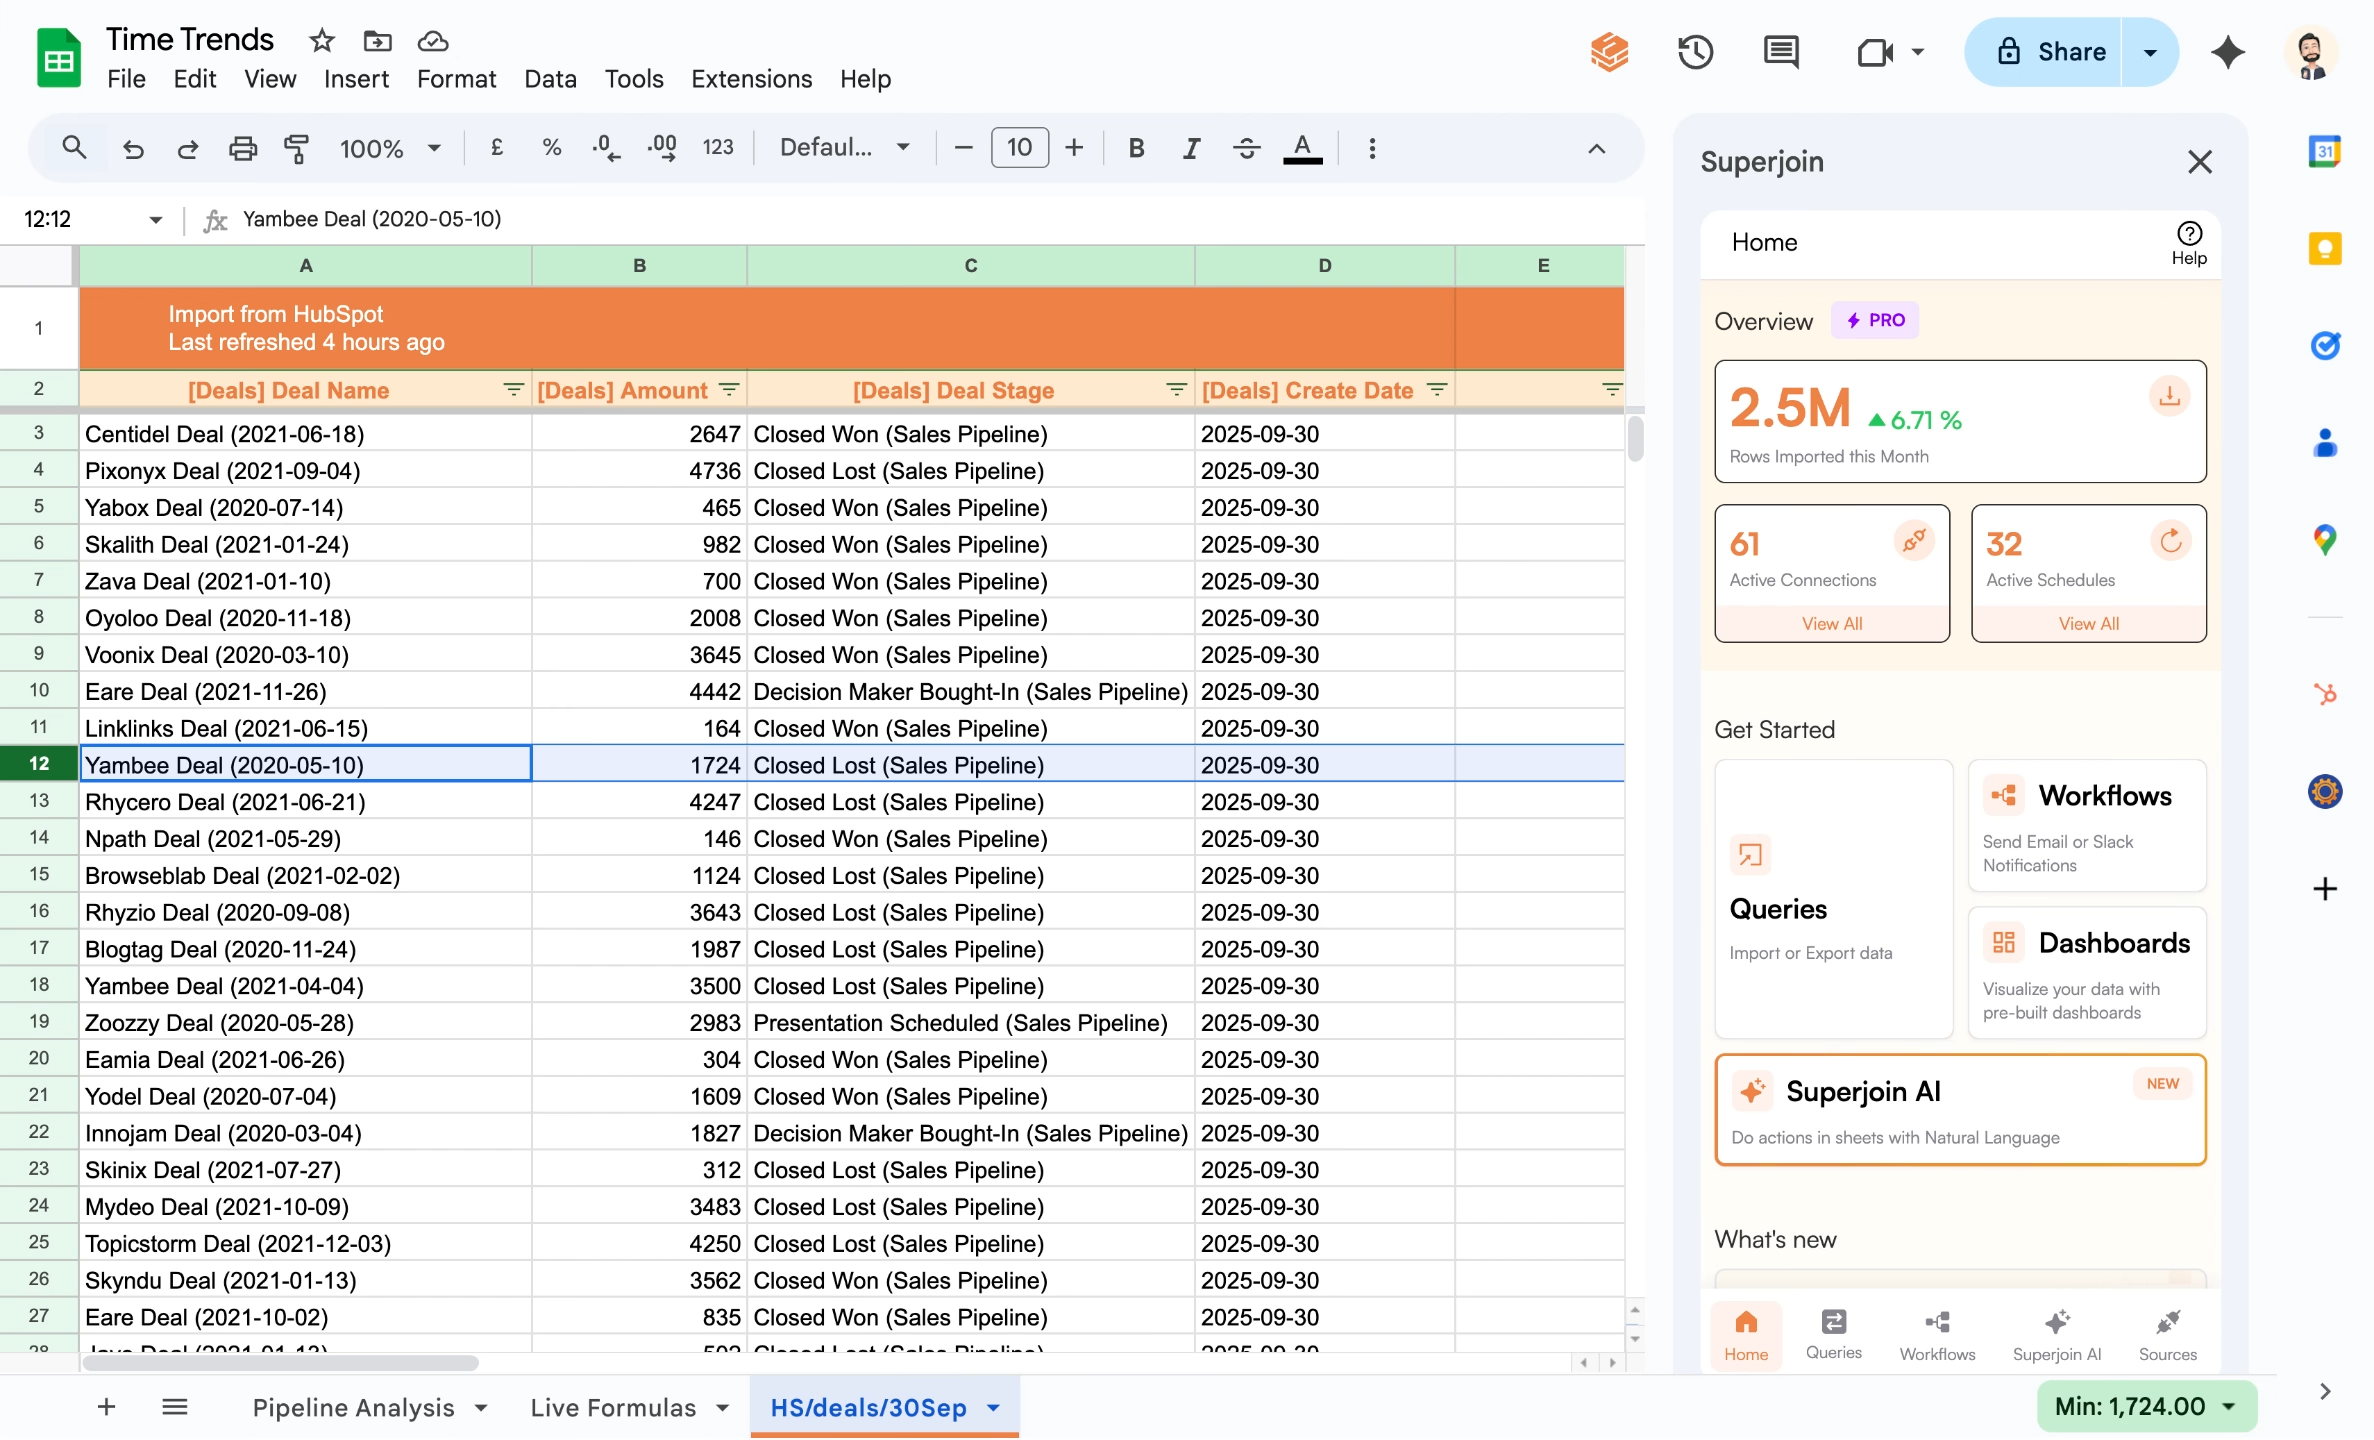
2
Create an intermediate sheet for formulas
Establish a separate middle-layer sheet to contain key metric formulas. This acts as a staging area for daily captures before values are overwritten by fresh data. These formulas dynamically reference your Superjoin sheet and stay up-to-date as new data comes in.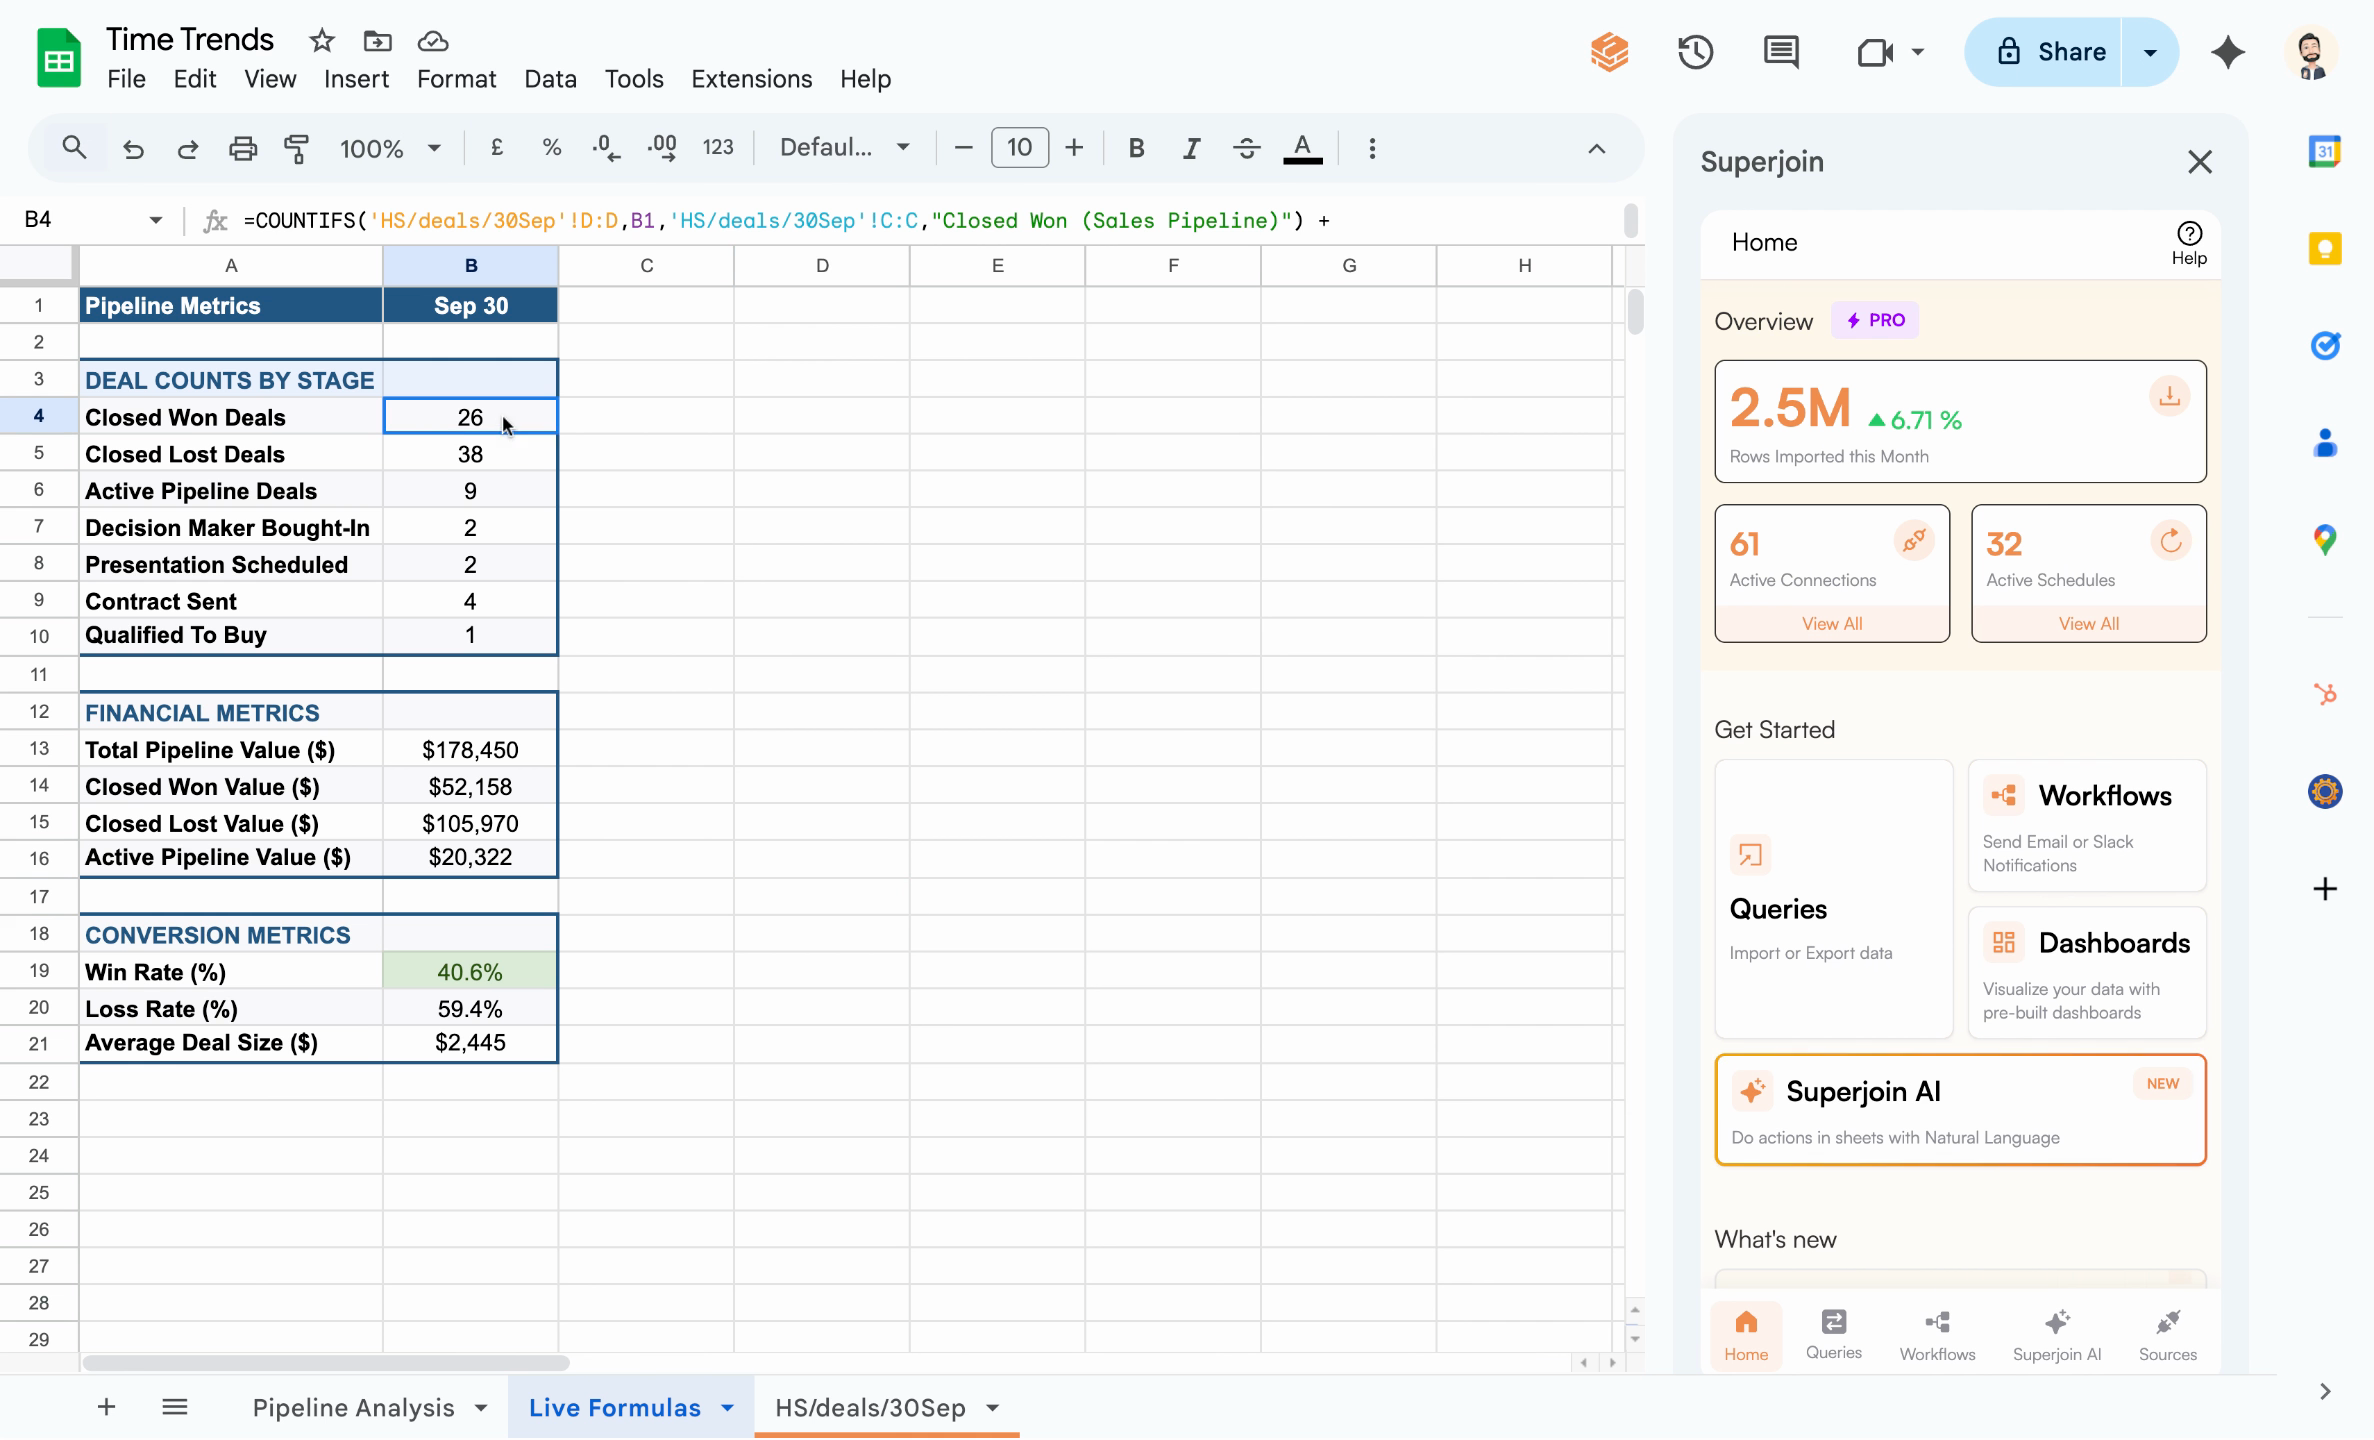
Because these formulas are live, yesterday’s values are lost after each update. We’ll capture values before they refresh.
3
Prepare a destination sheet for snapshots
Set up a final trends or analysis sheet to collect daily snapshots. You’ll automate copying values—not formulas—here, ensuring each day’s state is preserved after each refresh.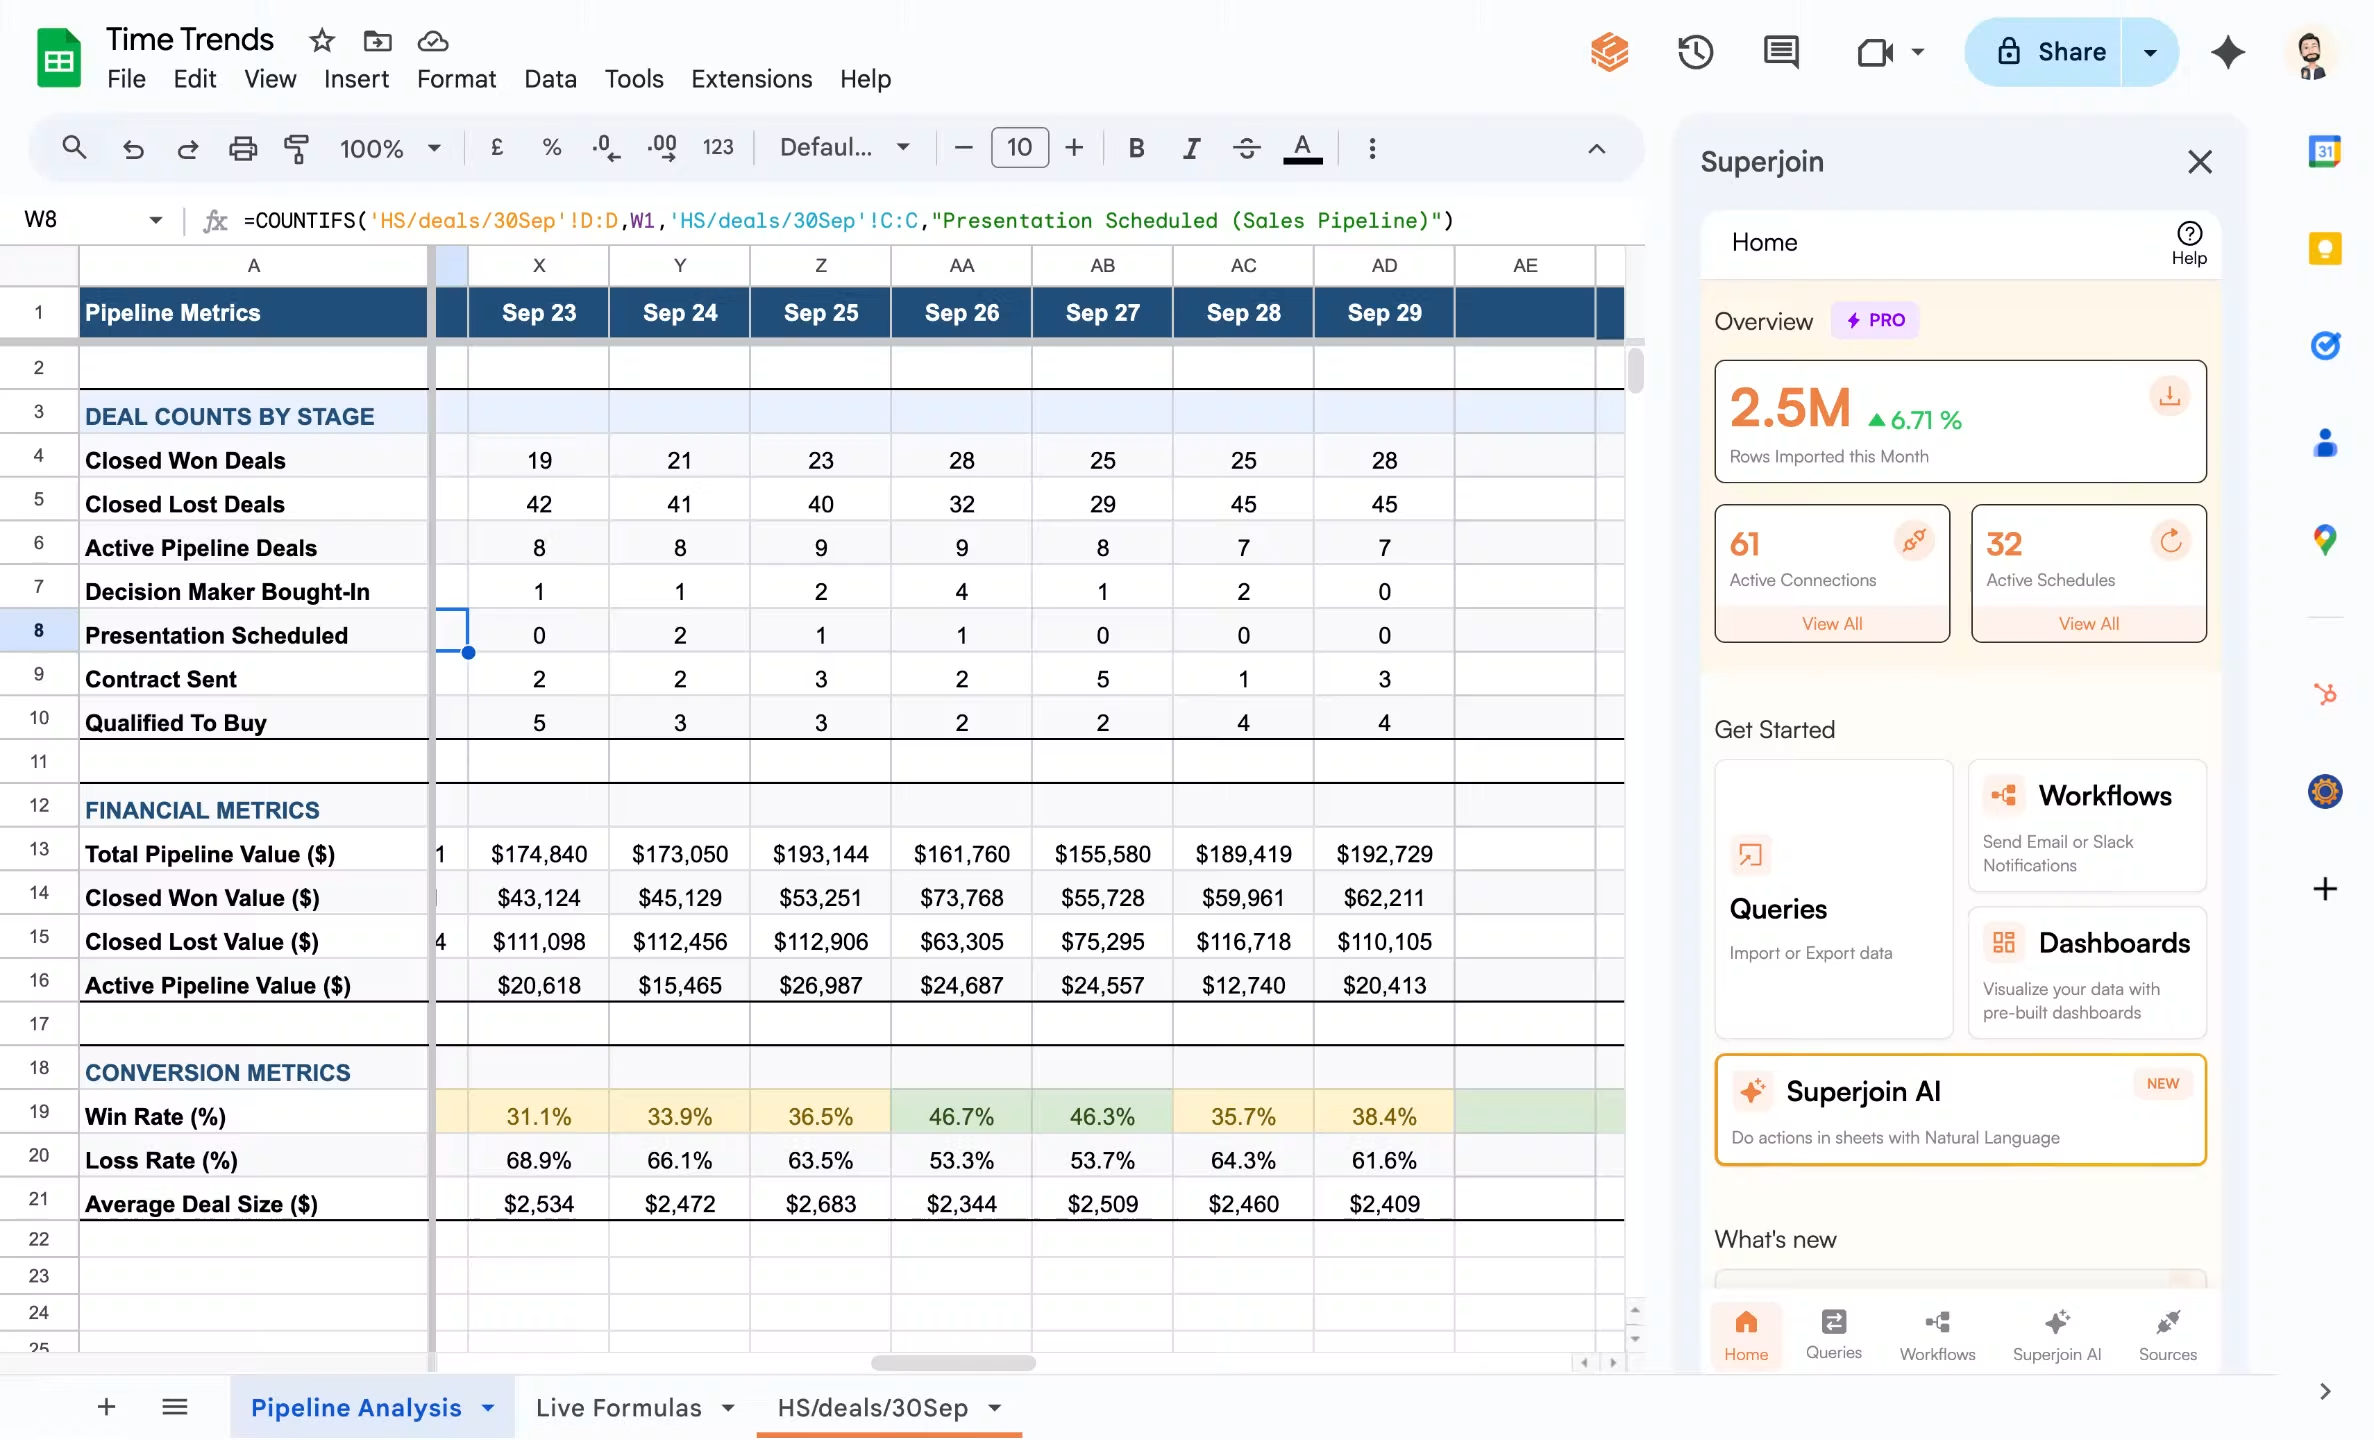
4
Automate capture with Workflows + Apps Script
Manually copying data every day is laborious and risks missing updates. Instead, leverage Superjoin Workflows and Google Sheets Apps Script to schedule and automate the capture process.
1
Open the Workflows menu
Click Workflows in Superjoin to get started.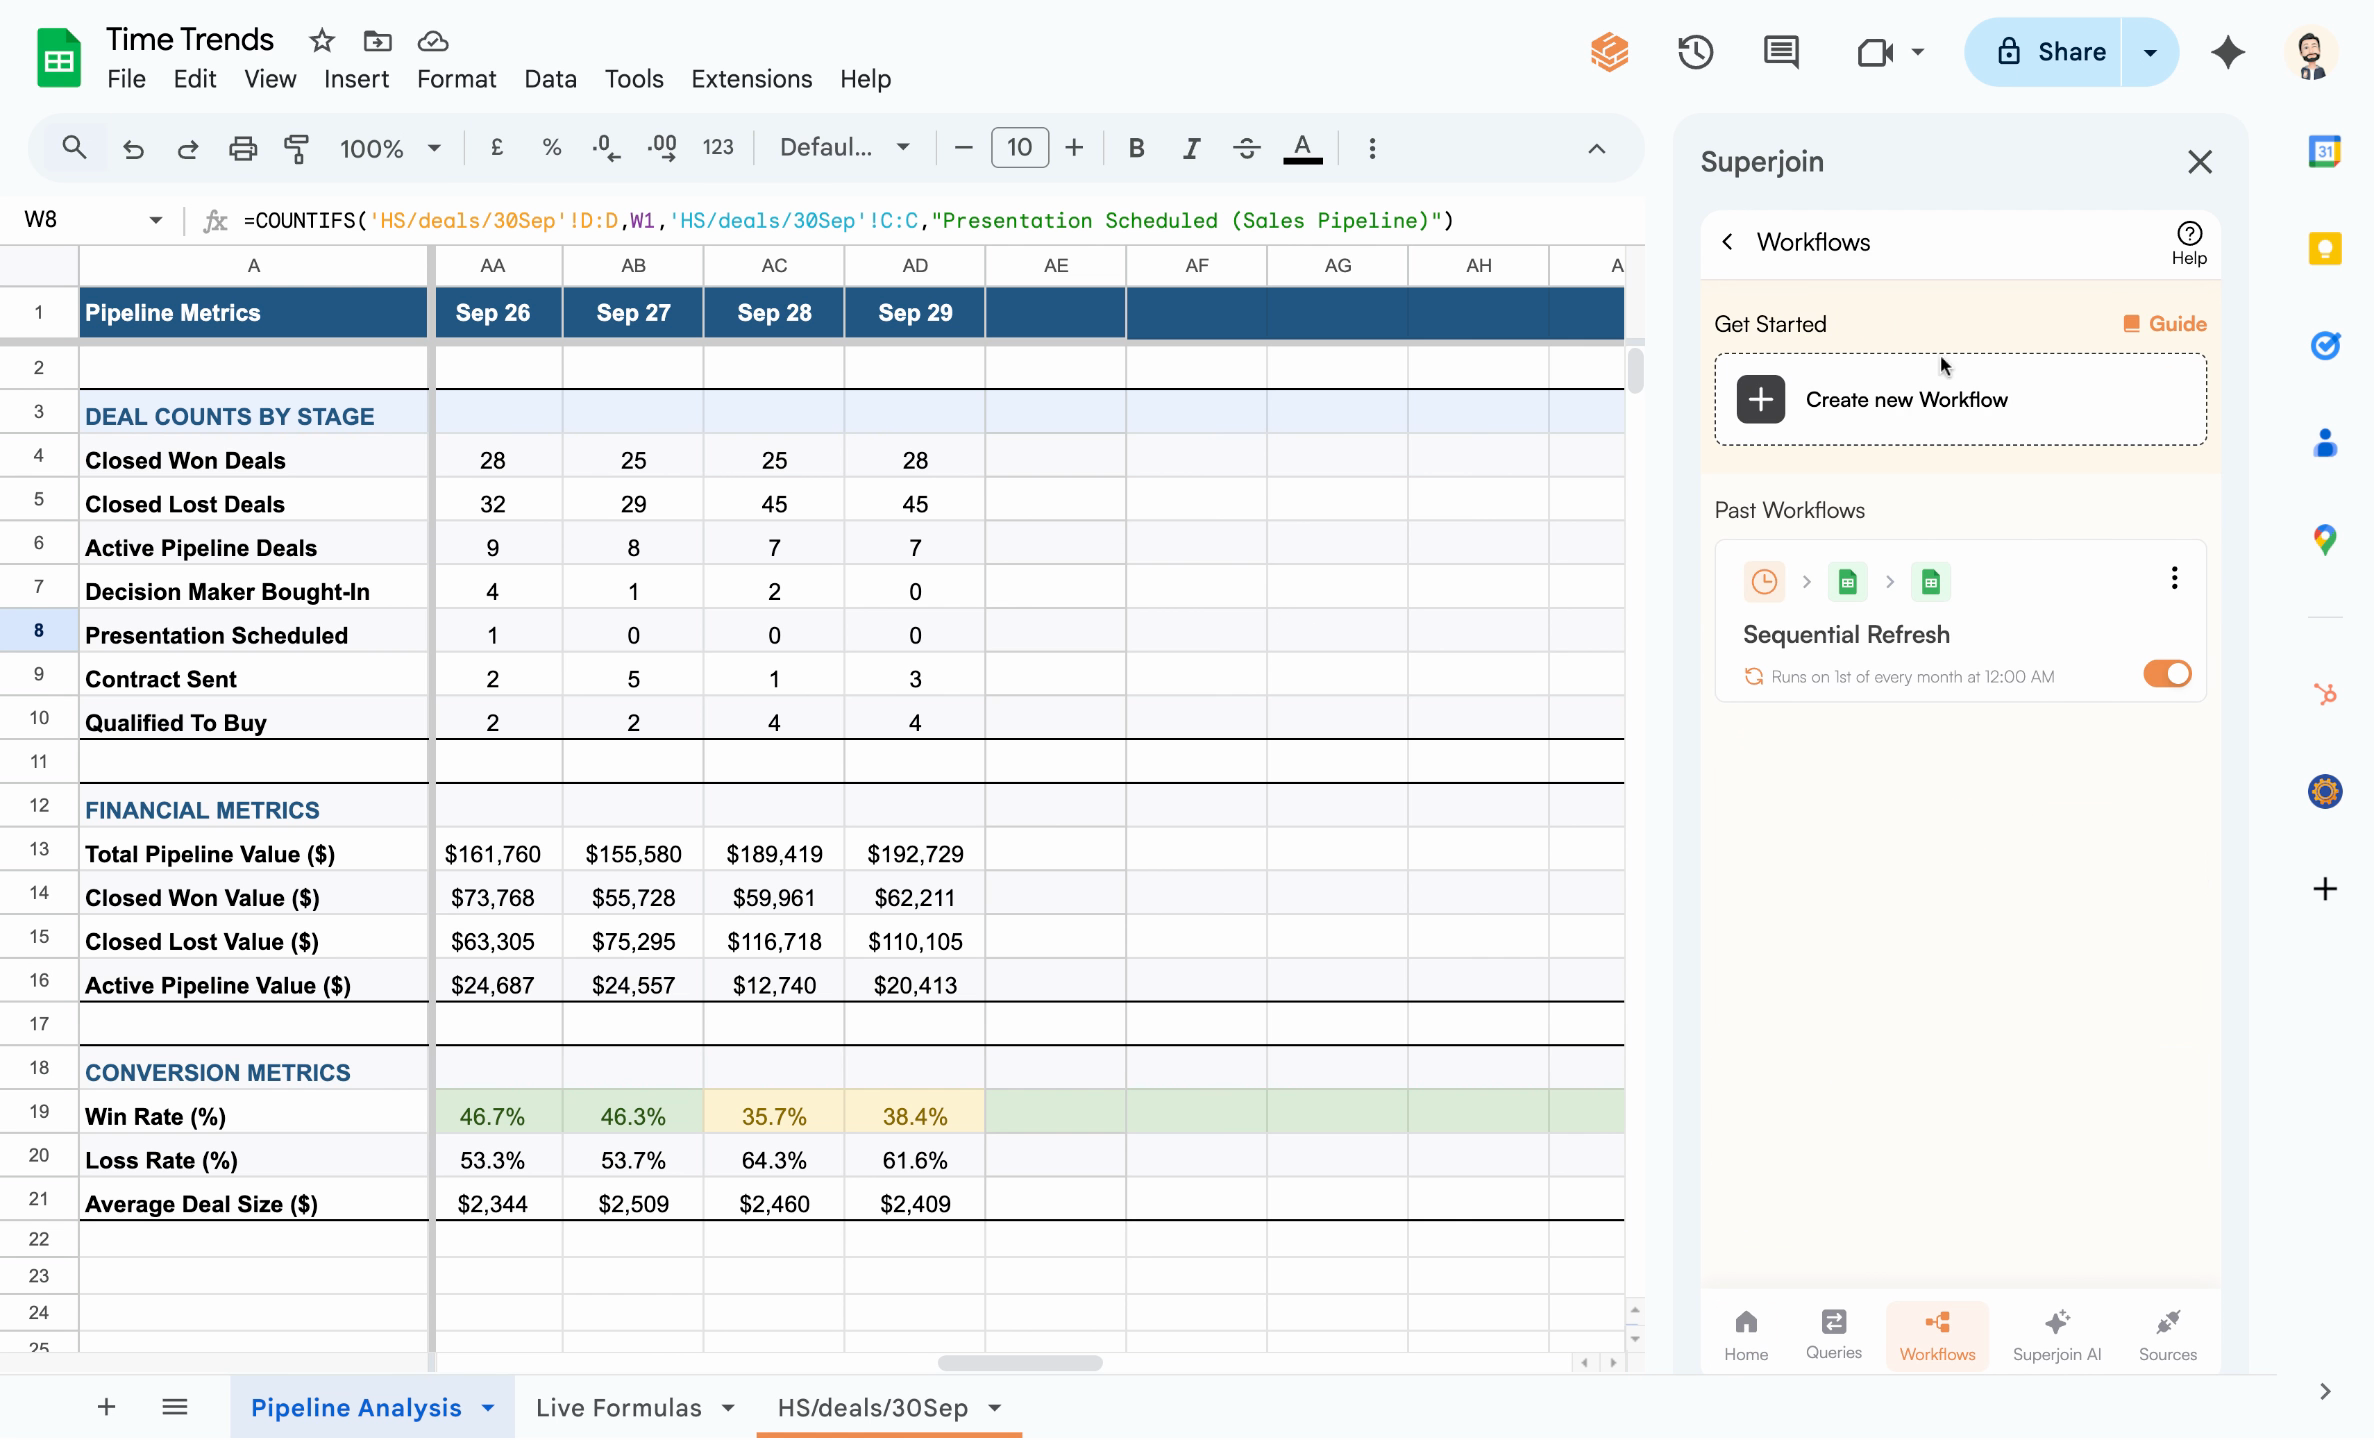
2
Create a new workflow
Click Create New Workflow and name it “Day on Day Trends” for easy identification.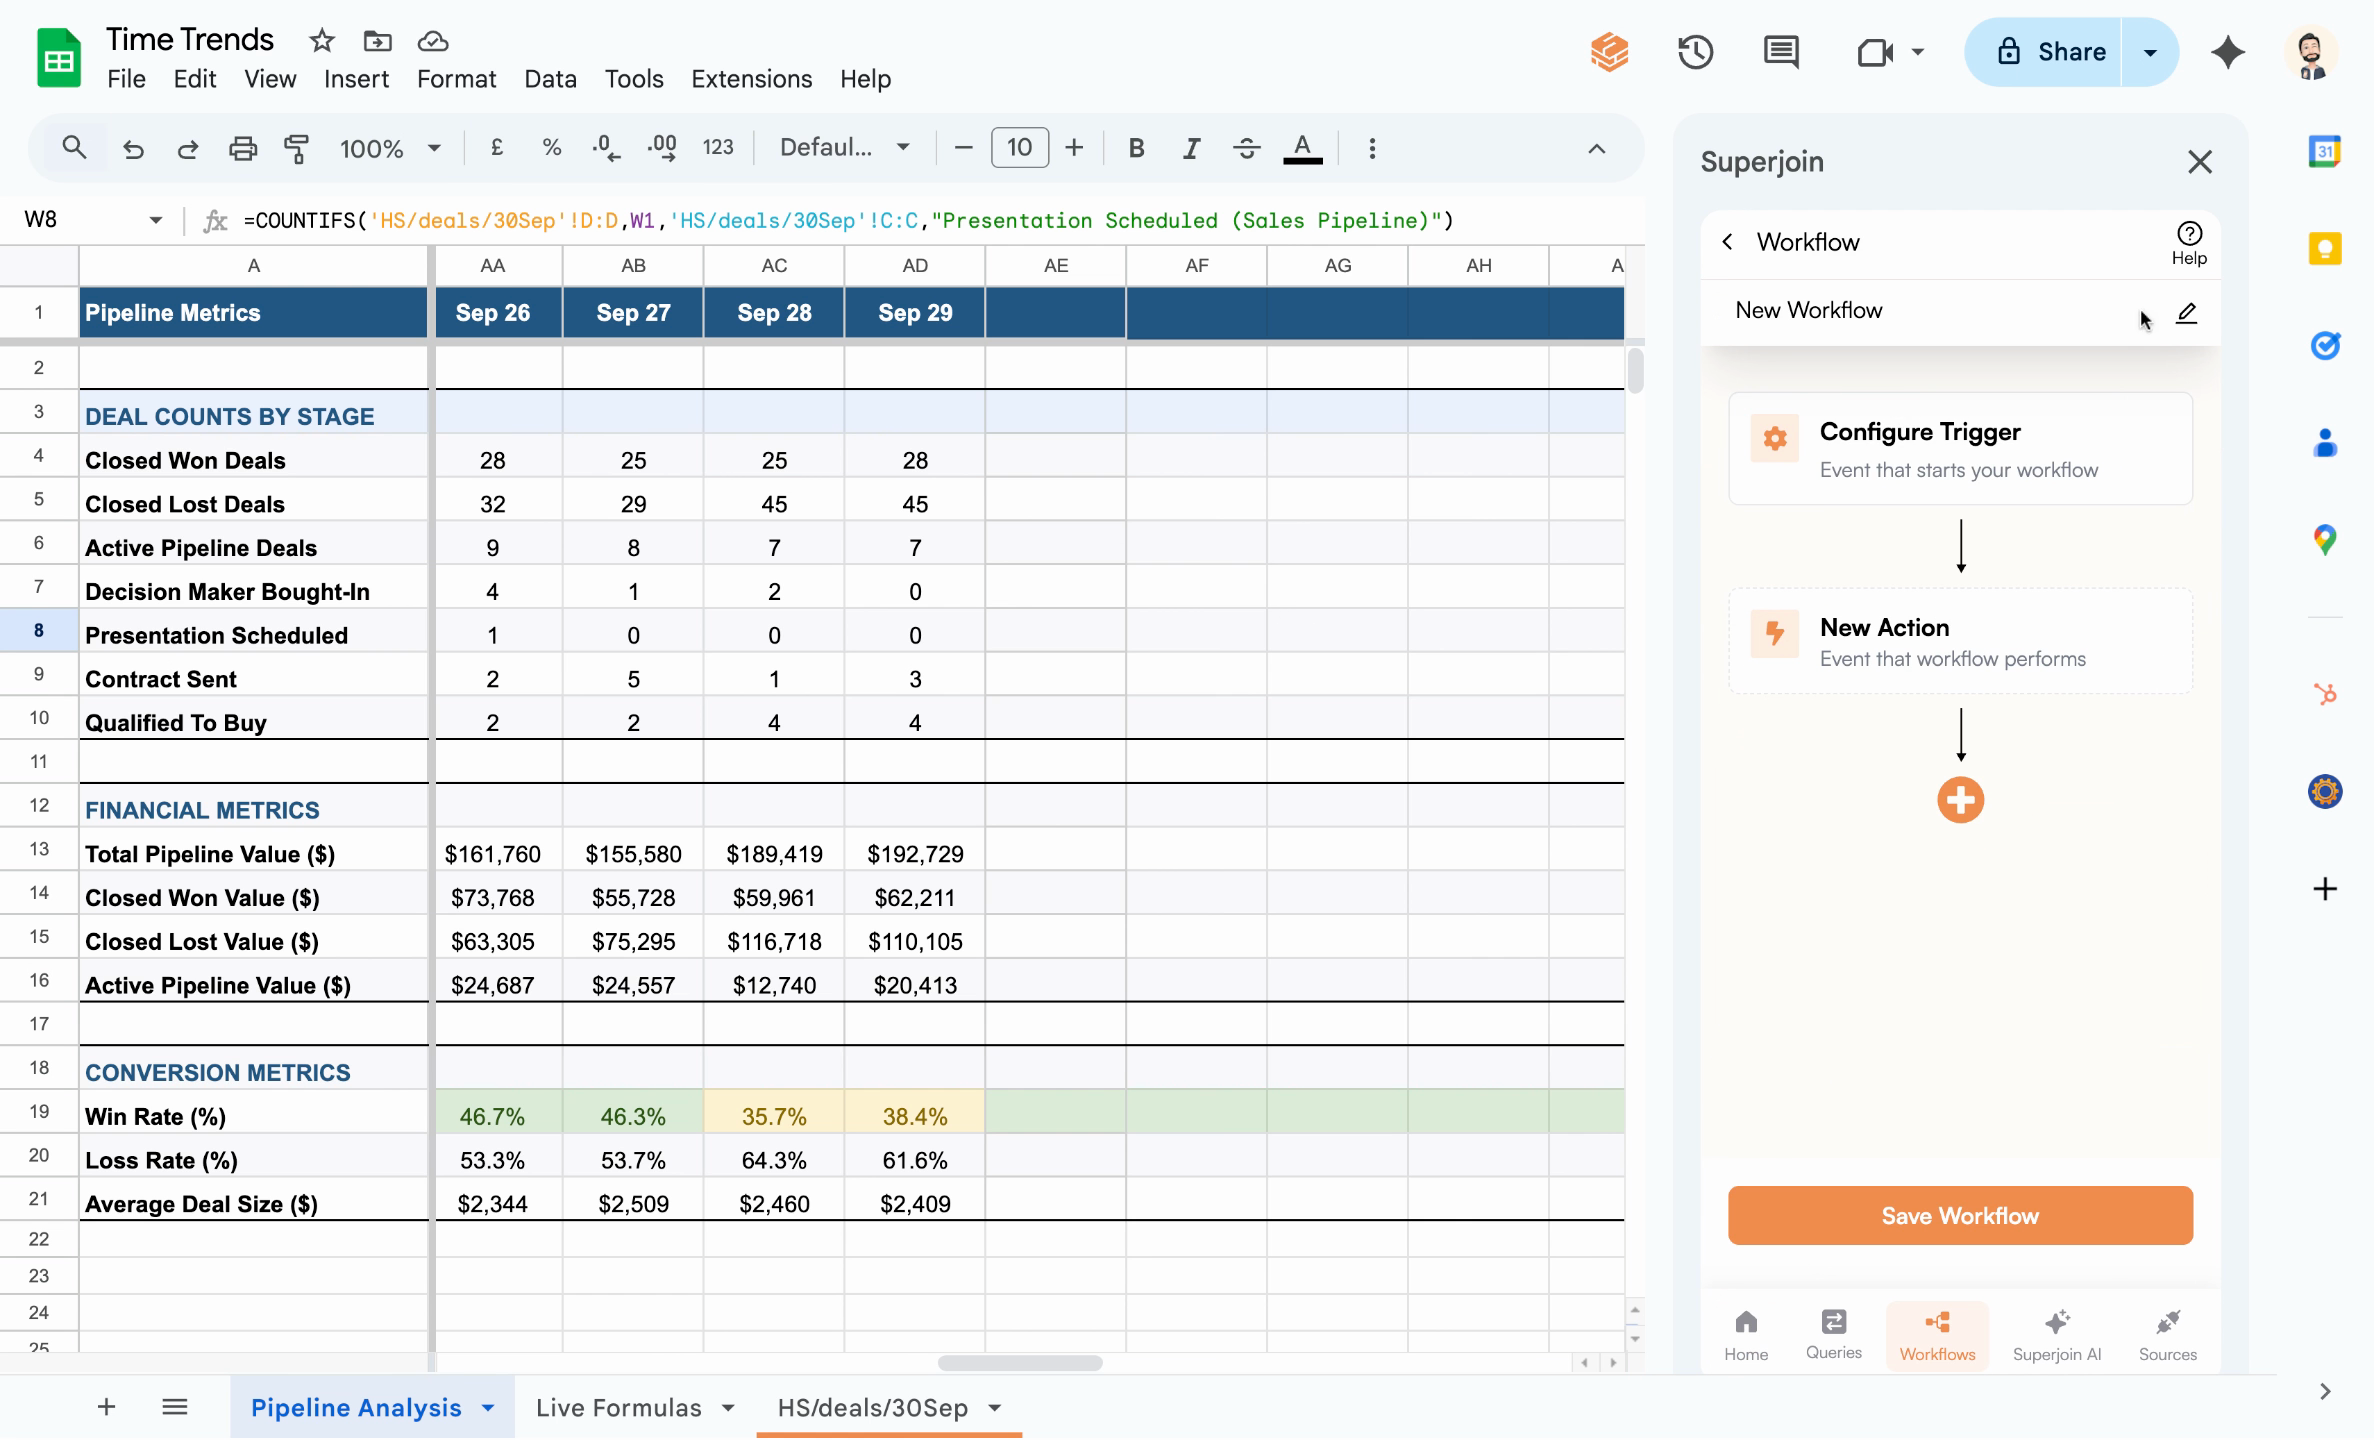
3
Add a daily trigger
Set a Trigger to run every day at a chosen time (e.g., 9am). This ensures your snapshot is taken before live data changes.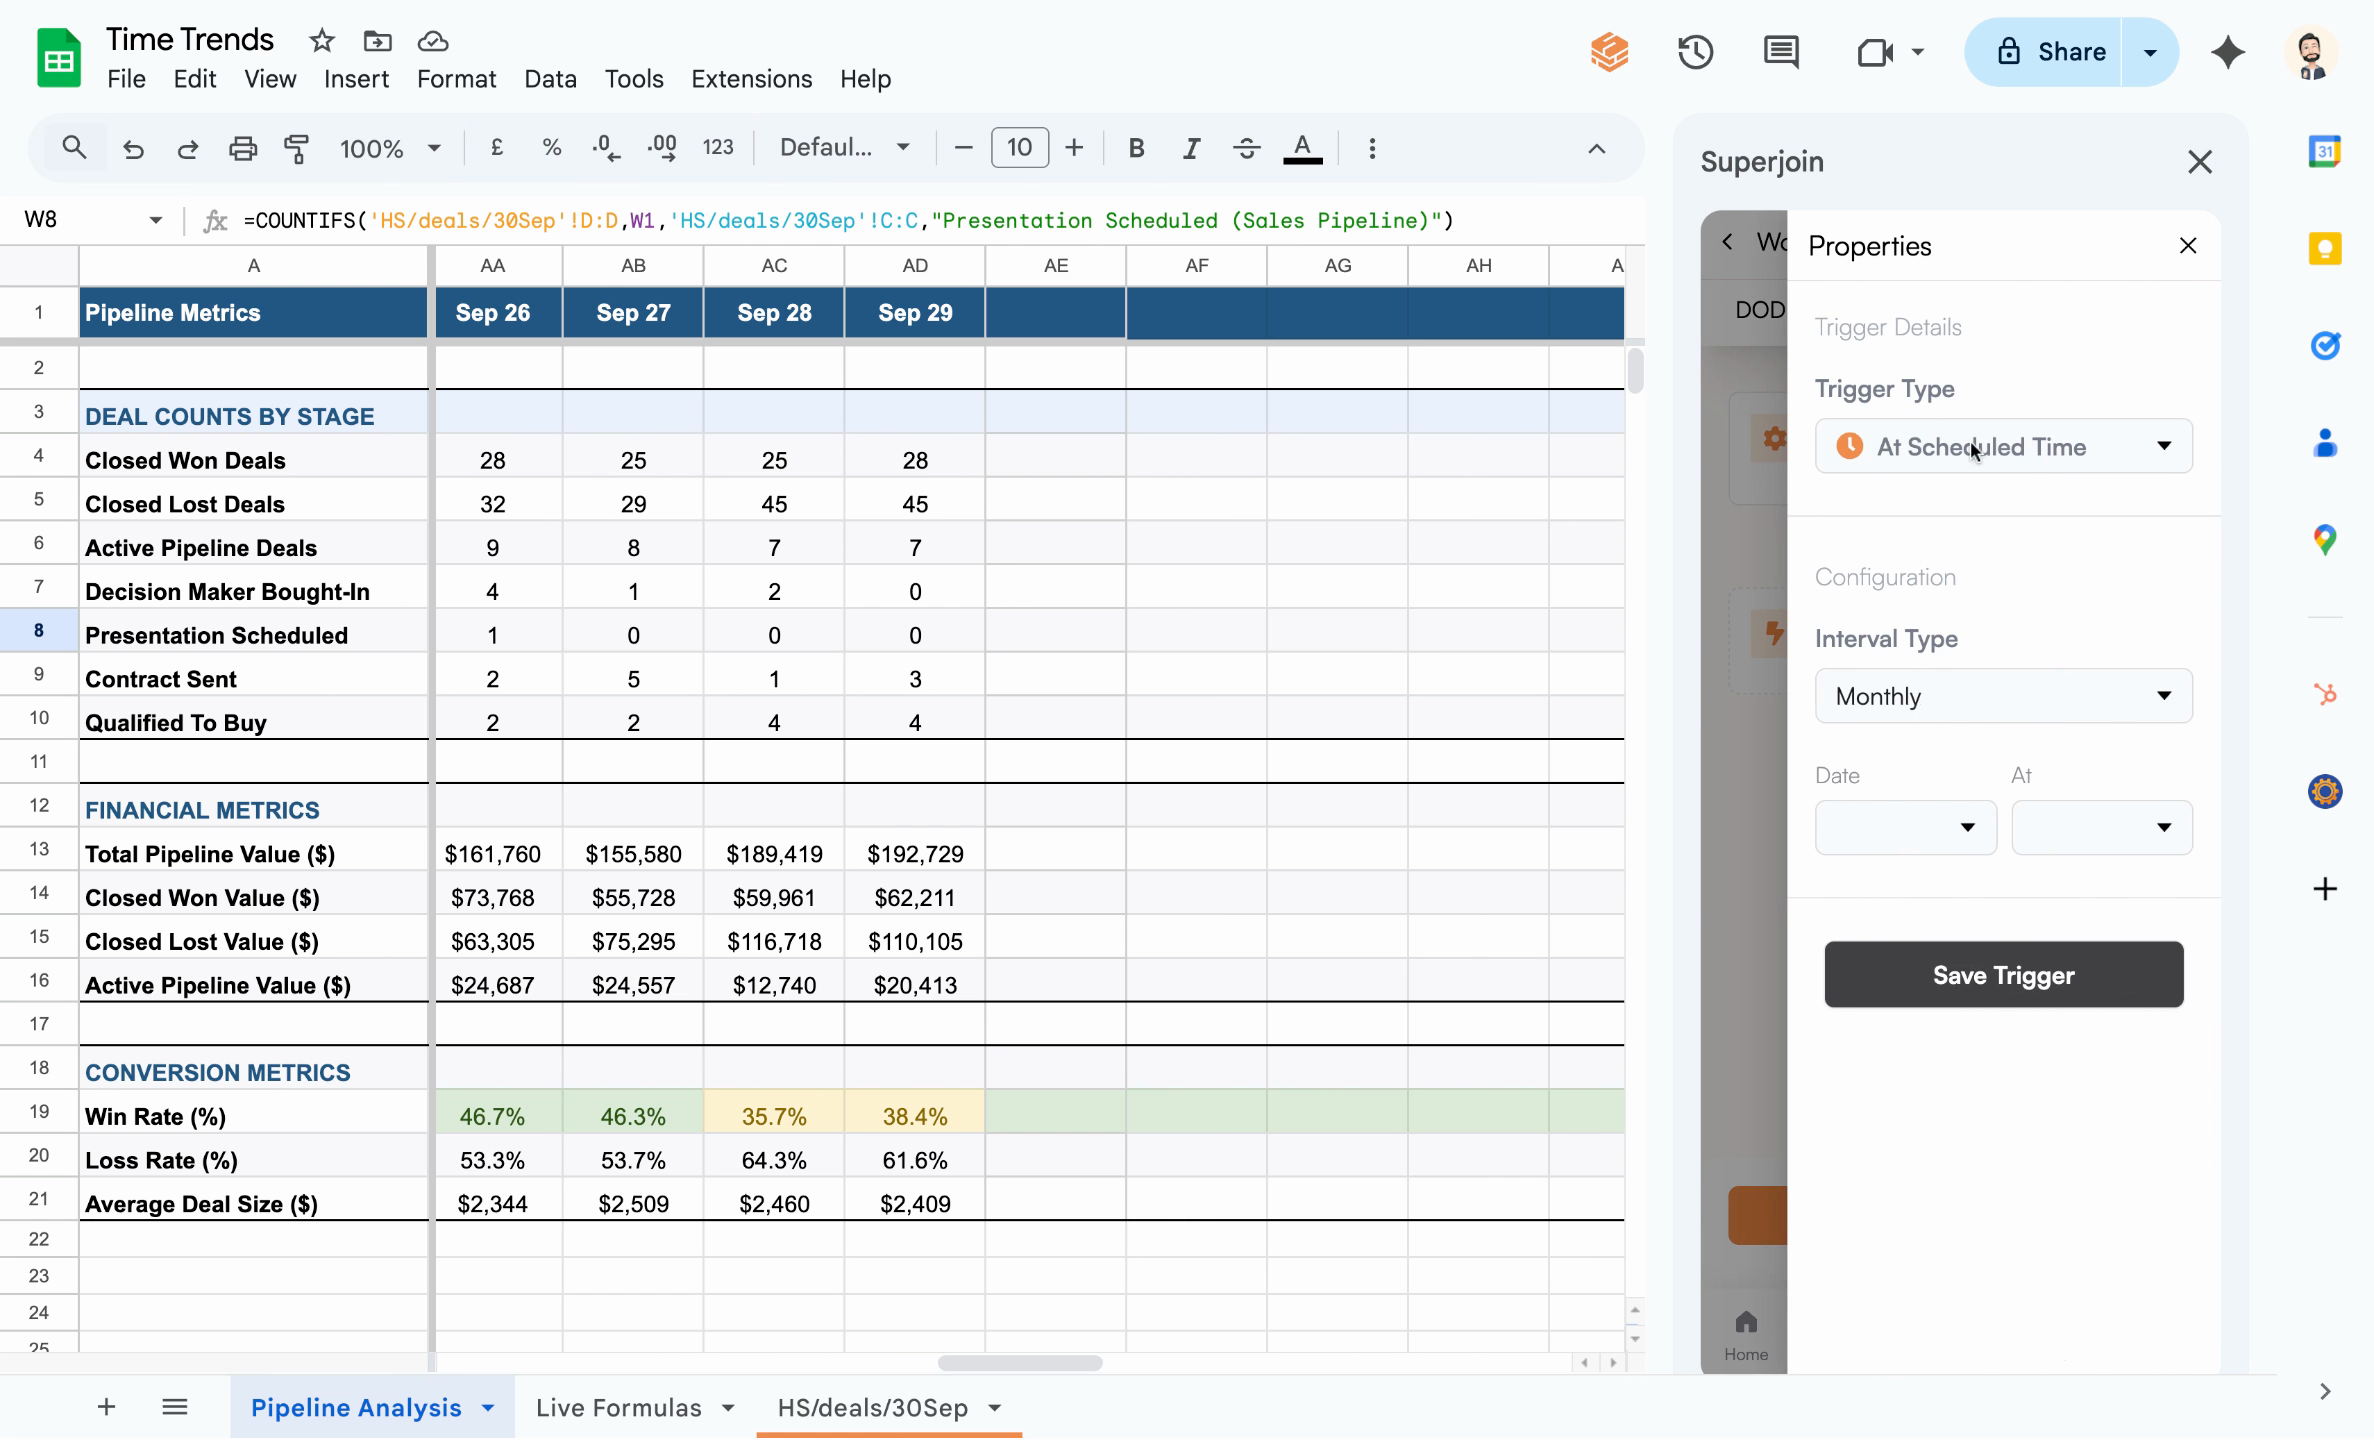
4
Add a refresh action
After the trigger, add an action to Refresh your connected data source (e.g., the “HubSpot” sheet), ensuring live data and formulas are up-to-date for today’s metrics.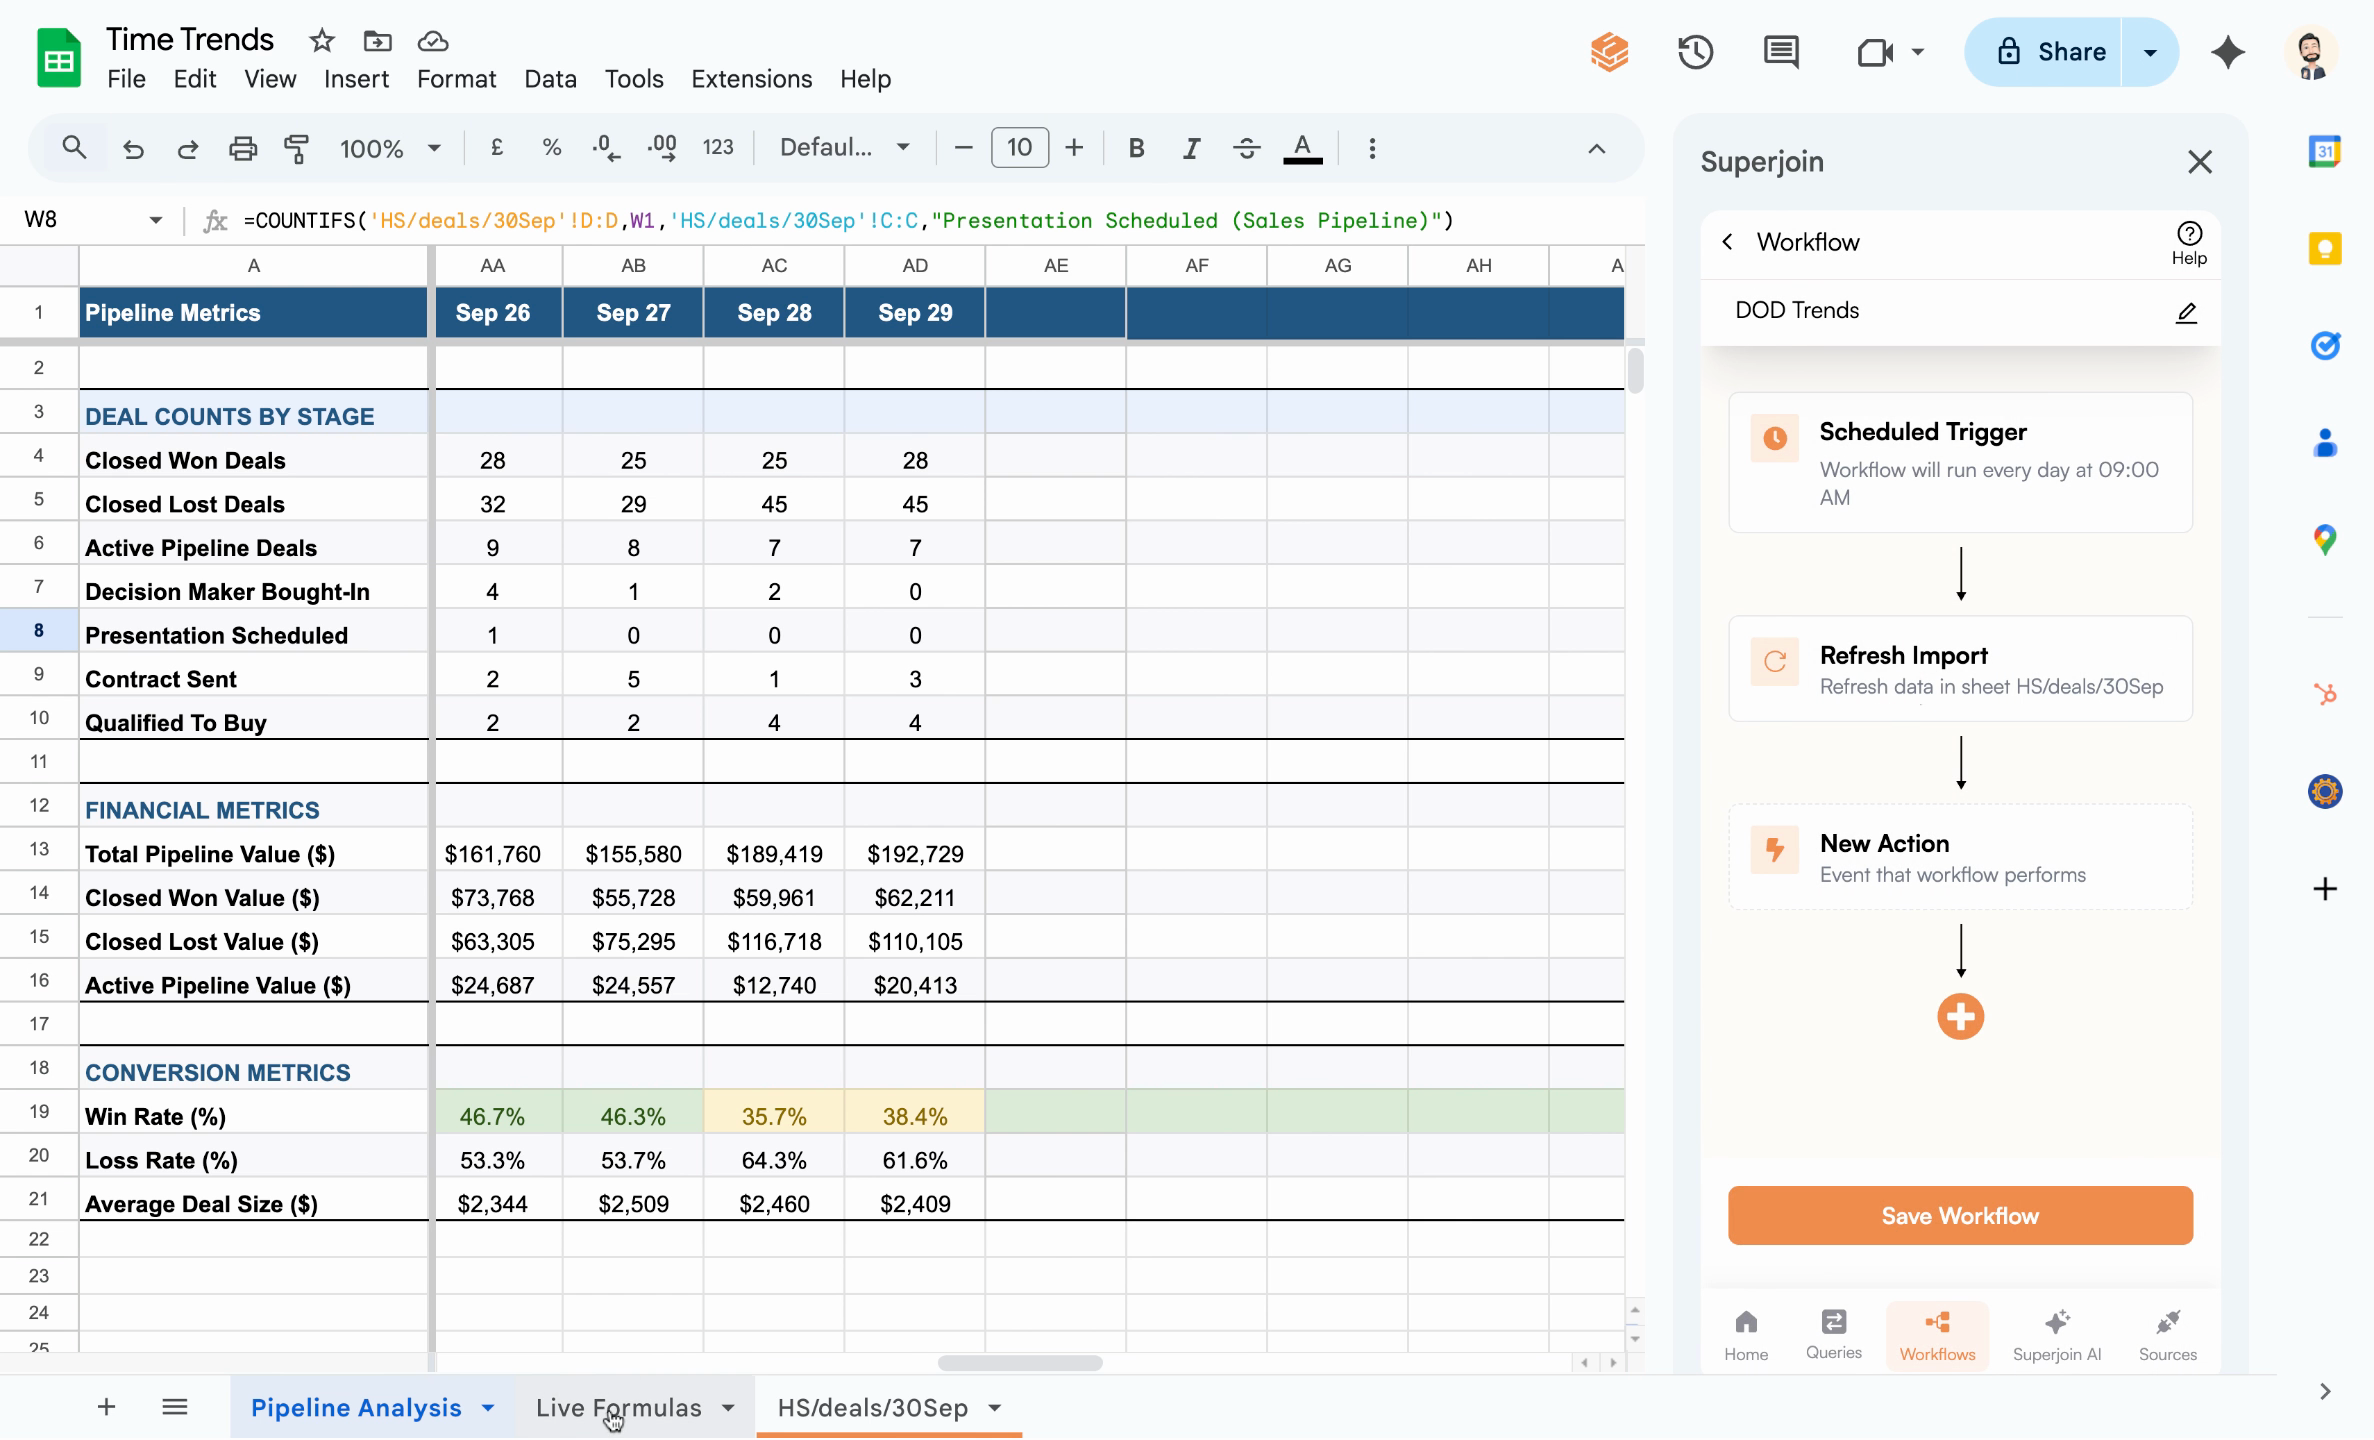
5
Run a script to paste values
Add a Run Script action to execute a Google Apps Script that copies today’s values (not formulas) from your intermediate formulas sheet into the analysis/trend sheet.
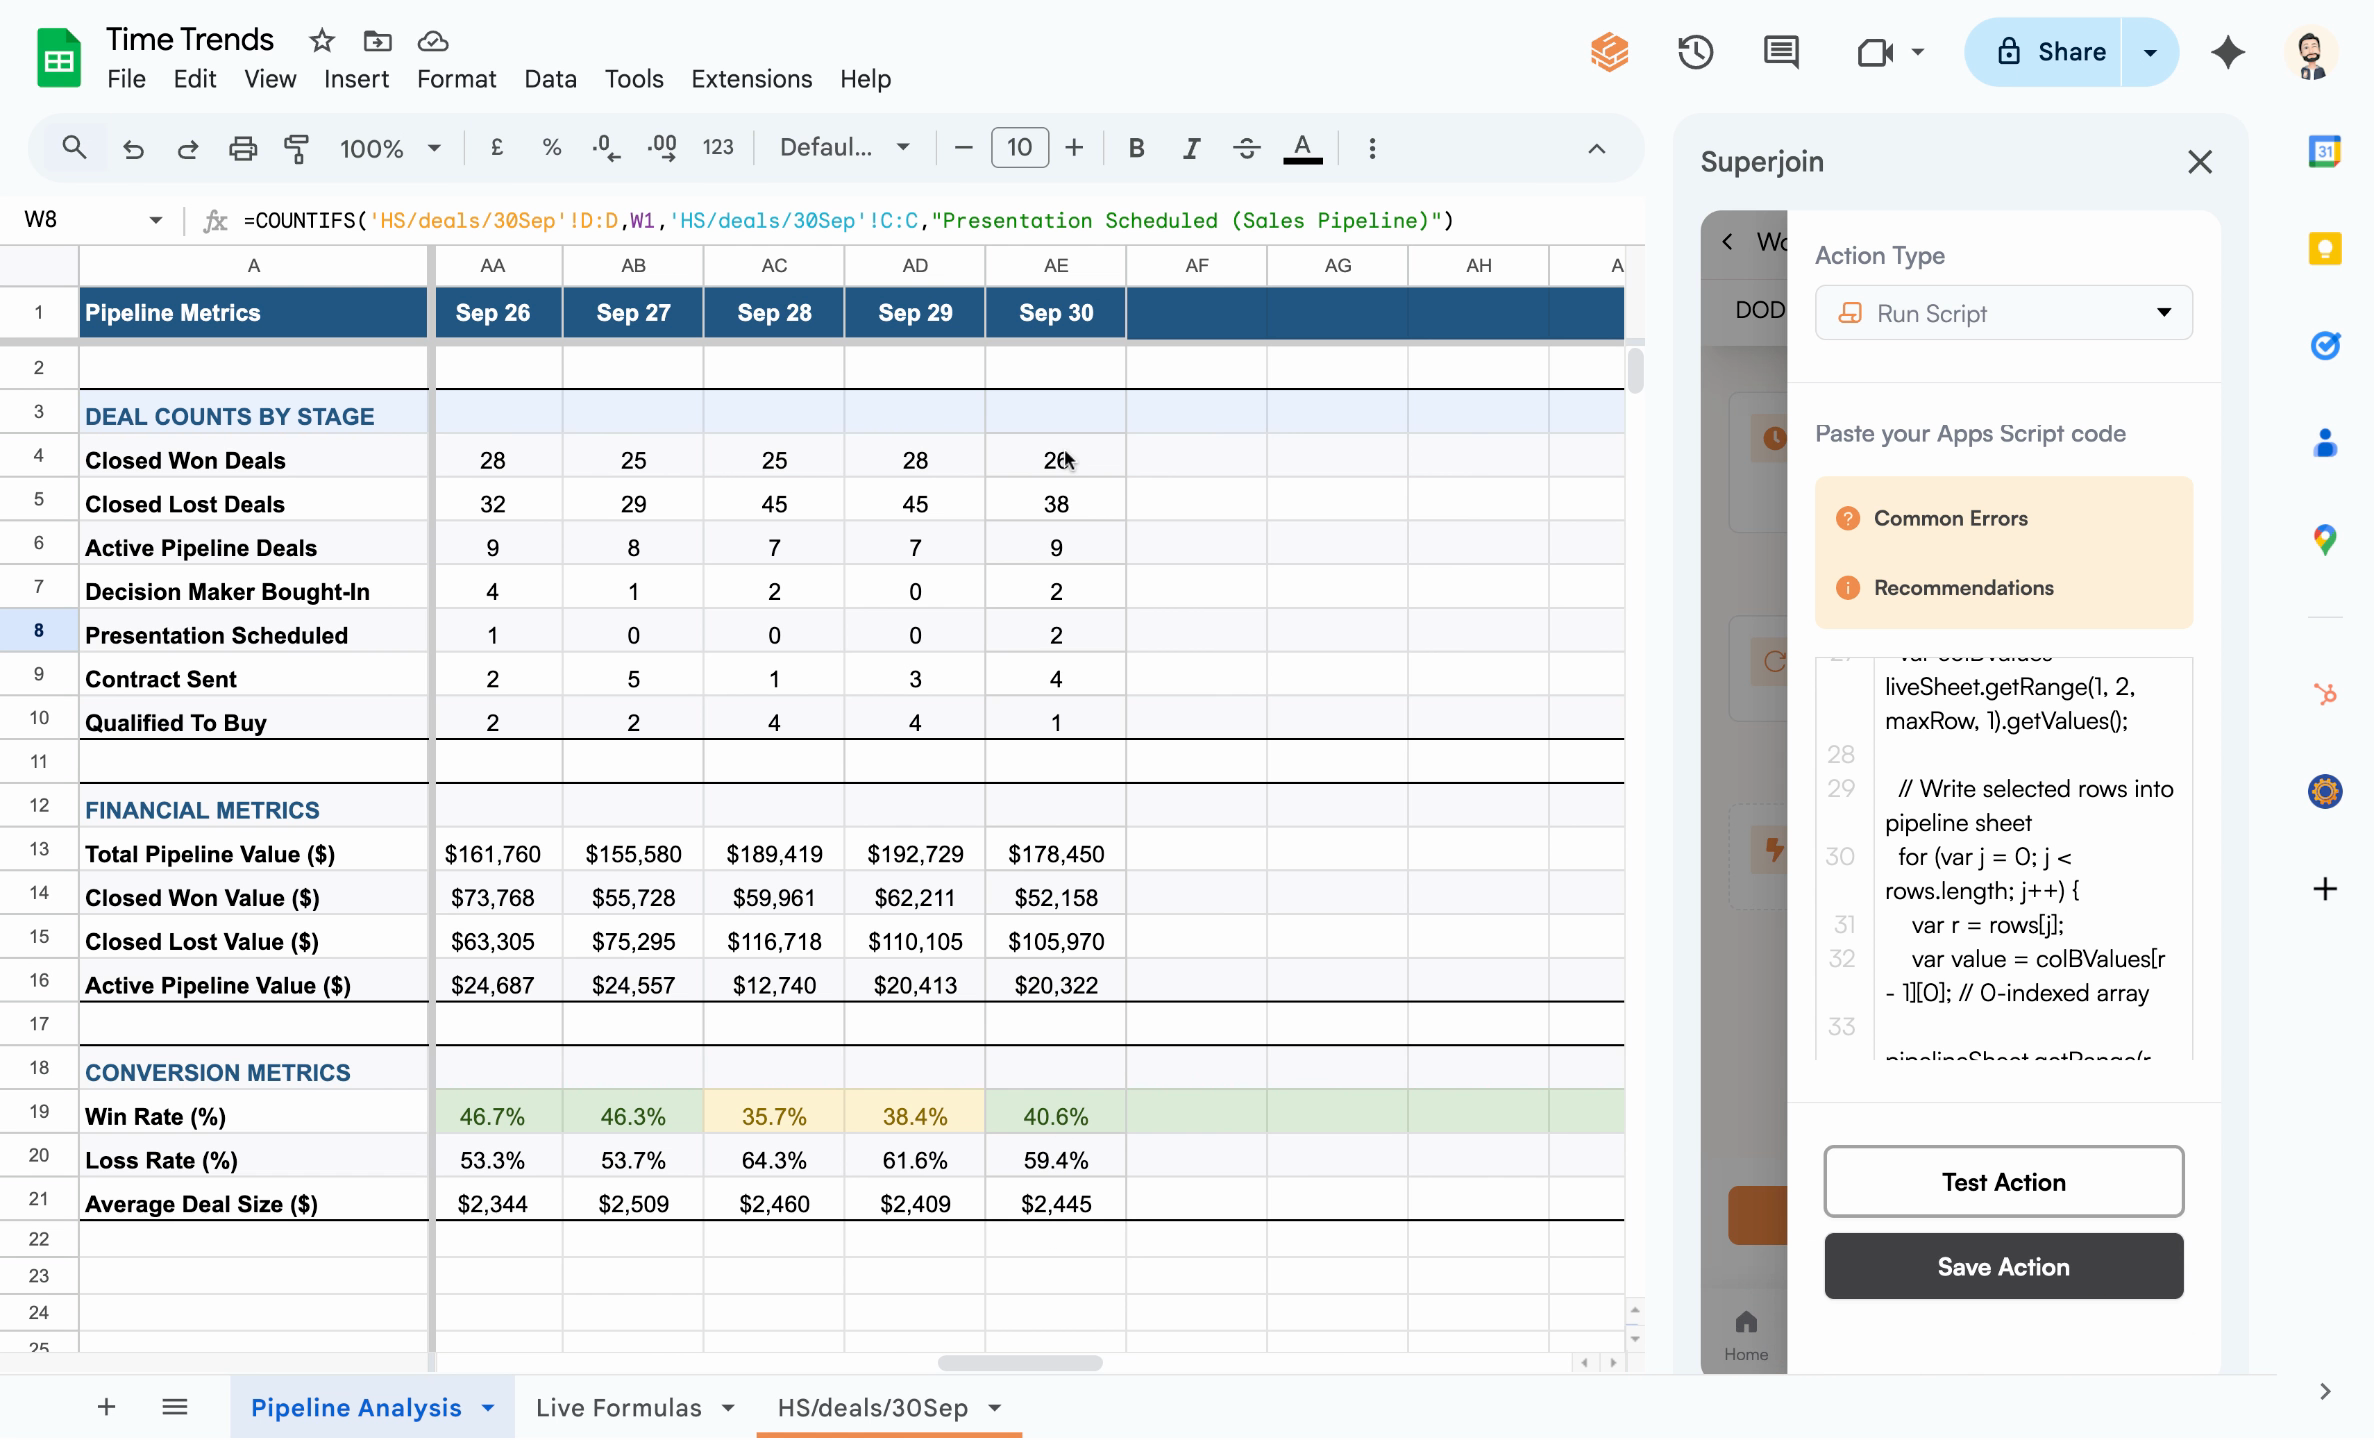
You can use Superjoin AI to generate the Apps Script. Click Test Action to verify.
It’s critical to paste values only—referencing formulas will result in dynamic updates, not historical snapshots.
Sample Apps Script: copy values from selected rows to the next empty column
Sample Script
6
Save the action and workflow
Click Save Action and then Save Workflow to finalize your automation. Your routine will now run daily, refreshing data and archiving each snapshot for seamless trend analysis.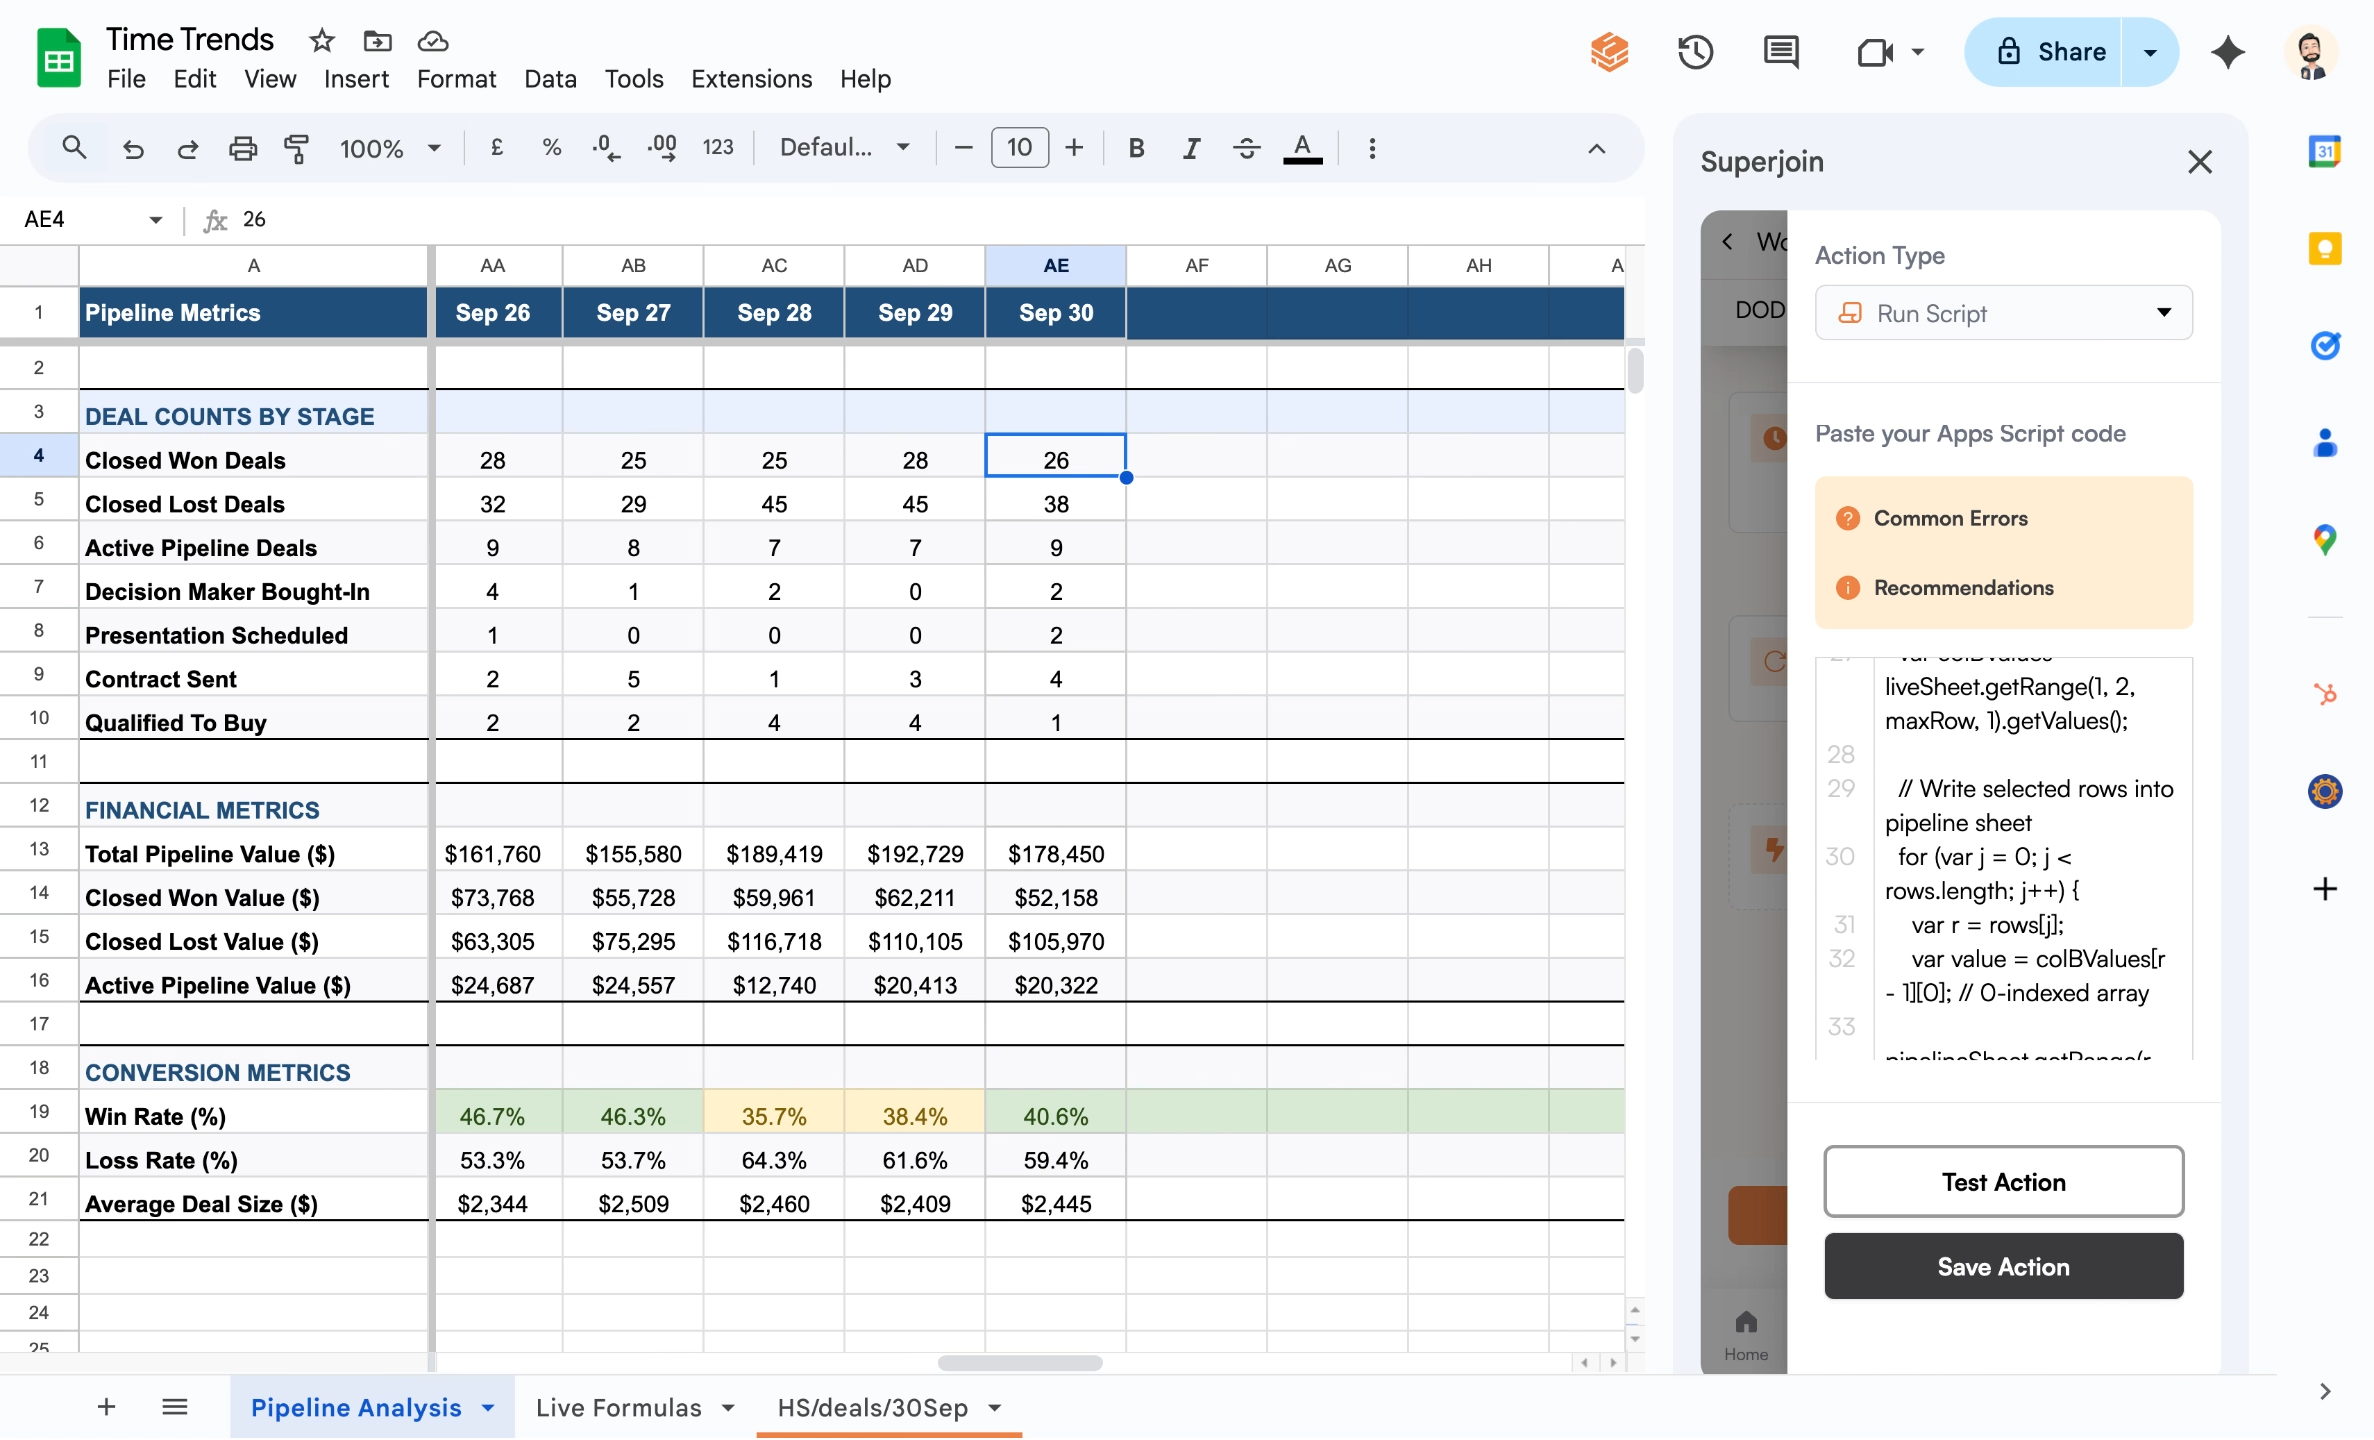
What’s next?
You now have an automated day-over-day trend system in Google Sheets powered by Superjoin. Every morning, your trend sheet will be updated automatically with the latest metrics, letting you analyze historical trends without manual work.- Set up email reports using Scheduled Reports
- Extend your workflow to capture other key metrics
- Visualize your trends with chart recommendations